 README
README
PI-Hole Prometheus Exporter
![]()

This is a Prometheus exporter for PI-Hole's Raspberry PI ad blocker.
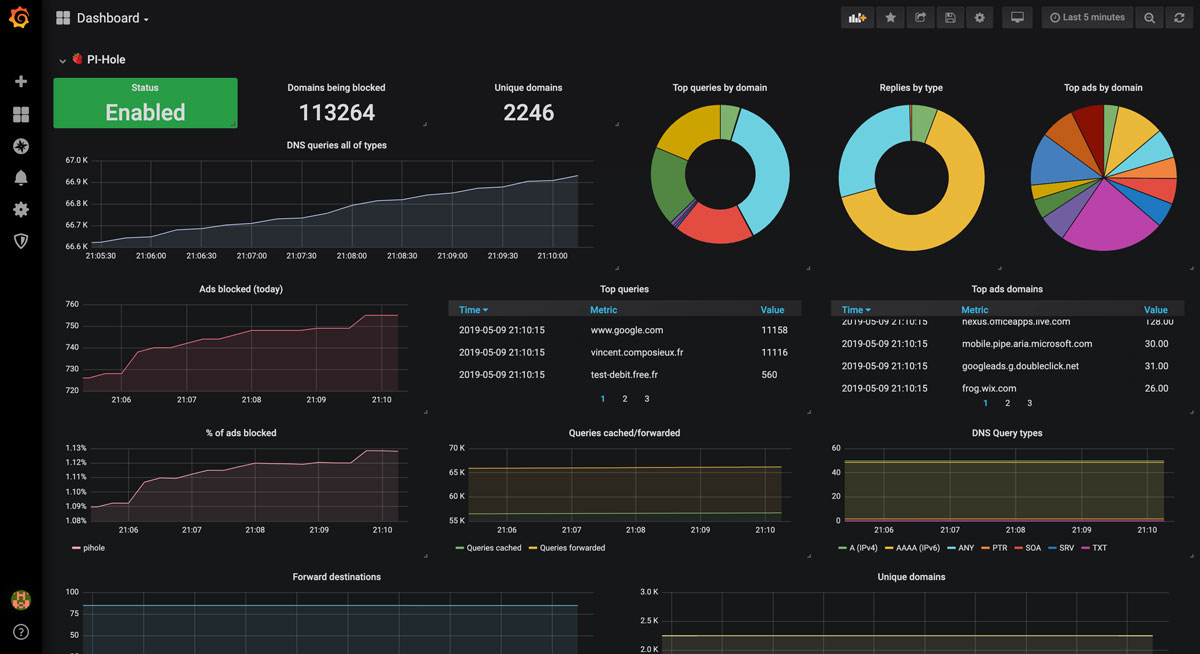
Grafana dashboard is available here on the Grafana dashboard website and also here on the GitHub repository.
Prerequisites
Installation
Download binary
You can download the latest version of the binary built for your architecture here:
- Architecture i386 [ Linux / Windows ]
- Architecture amd64 [ Darwin / Linux / Windows ]
- Architecture arm [ Darwin / Linux ]
Using Docker
The exporter is also available as a Docker image. You can run it using the following example and pass configuration environment variables:
$ docker run \
  -e 'PIHOLE_HOSTNAME=192.168.1.2' \
  -e 'PIHOLE_PASSWORD=mypassword' \
  -e 'INTERVAL=30s' \
  -e 'PORT=9617' \
  -p 9617:9617 \
  ekofr/pihole-exporter:latest
Or use PiHole's WEBPASSWORD as an API token instead of the password
$ API_TOKEN=$(awk -F= -v key="WEBPASSWORD" '$1==key {print $2}' /etc/pihole/setupVars.conf)
$ docker run \
  -e 'PIHOLE_HOSTNAME=192.168.1.2' \
  -e "PIHOLE_API_TOKEN=$API_TOKEN" \
  -e 'INTERVAL=30s' \
  -e 'PORT=9617' \
  ekofr/pihole-exporter:latest
If you are running pi-hole behind https, you must both set the PIHOLE_PROTOCOL environment variable
as well as include your ssl certificates to the docker image as it does not have any baked in:
$ docker run \
  -e 'PIHOLE_PROTOCOL=https' \
  -e 'PIHOLE_HOSTNAME=192.168.1.2' \
  -e 'PIHOLE_PASSWORD=mypassword' \
  -e 'INTERVAL=30s' \
  -e 'PORT=9617' \
  -v '/etc/ssl/certs:/etc/ssl/certs:ro' \
  -p 9617:9617 \
  ekofr/pihole-exporter:latest
A single instance of pihole-exporter can monitor multiple pi-holes instances. To do so, you can specify a list of hostnames, protocols, passwords/API tokens and ports by separating them with commas in their respective environment variable:
$ docker run \
  -e 'PIHOLE_PROTOCOL="http,http,http" \
  -e 'PIHOLE_HOSTNAME="192.168.1.2,192.168.1.3,192.168.1.4"' \
  -e "PIHOLE_API_TOKEN="$API_TOKEN1,$API_TOKEN2,$API_TOKEN3" \
  -e "PIHOLE_PORT="8080,8081,8080" \
  -e 'INTERVAL=30s' \
  -e 'PORT=9617' \
  ekofr/pihole-exporter:latest
If port, protocol and API token/password is the same for all instances, you can specify them only once:
$ docker run \
  -e 'PIHOLE_PROTOCOL=",http" \
  -e 'PIHOLE_HOSTNAME="192.168.1.2,192.168.1.3,192.168.1.4"' \
  -e "PIHOLE_API_TOKEN="$API_TOKEN" \
  -e "PIHOLE_PORT="8080" \
  -e 'INTERVAL=30s' \
  -e 'PORT=9617' \
  ekofr/pihole-exporter:latest
From sources
Optionally, you can download and build it from the sources. You have to retrieve the project sources by using one of the following way:
$ go get -u github.com/eko/pihole-exporter
# or
$ git clone https://github.com/eko/pihole-exporter.git
Install the needed vendors:
$ GO111MODULE=on go mod vendor
Then, build the binary (here, an example to run on Raspberry PI ARM architecture):
$ GOOS=linux GOARCH=arm GOARM=7 go build -o pihole_exporter .
Usage
In order to run the exporter, type the following command (arguments are optional):
Using a password
$ ./pihole_exporter -pihole_hostname 192.168.1.10 -pihole_password azerty
Or use PiHole's WEBPASSWORD as an API token instead of the password
$ API_TOKEN=$(awk -F= -v key="WEBPASSWORD" '$1==key {print $2}' /etc/pihole/setupVars.conf)
$ ./pihole_exporter -pihole_hostname 192.168.1.10 -pihole_api_token $API_TOKEN
2019/05/09 20:19:52 ------------------------------------
2019/05/09 20:19:52 -  PI-Hole exporter configuration  -
2019/05/09 20:19:52 ------------------------------------
2019/05/09 20:19:52 PIHoleHostname : 192.168.1.10
2019/05/09 20:19:52 PIHolePassword : azerty
2019/05/09 20:19:52 Port : 9617
2019/05/09 20:19:52 Interval : 10s
2019/05/09 20:19:52 ------------------------------------
2019/05/09 20:19:52 New Prometheus metric registered: domains_blocked
2019/05/09 20:19:52 New Prometheus metric registered: dns_queries_today
2019/05/09 20:19:52 New Prometheus metric registered: ads_blocked_today
2019/05/09 20:19:52 New Prometheus metric registered: ads_percentag_today
2019/05/09 20:19:52 New Prometheus metric registered: unique_domains
2019/05/09 20:19:52 New Prometheus metric registered: queries_forwarded
2019/05/09 20:19:52 New Prometheus metric registered: queries_cached
2019/05/09 20:19:52 New Prometheus metric registered: clients_ever_seen
2019/05/09 20:19:52 New Prometheus metric registered: unique_clients
2019/05/09 20:19:52 New Prometheus metric registered: dns_queries_all_types
2019/05/09 20:19:52 New Prometheus metric registered: reply
2019/05/09 20:19:52 New Prometheus metric registered: top_queries
2019/05/09 20:19:52 New Prometheus metric registered: top_ads
2019/05/09 20:19:52 New Prometheus metric registered: top_sources
2019/05/09 20:19:52 New Prometheus metric registered: forward_destinations
2019/05/09 20:19:52 New Prometheus metric registered: querytypes
2019/05/09 20:19:52 New Prometheus metric registered: status
2019/05/09 20:19:52 Starting HTTP server
2019/05/09 20:19:54 New tick of statistics: 648 ads blocked / 66796 total DNS querie
...
Once the exporter is running, you also have to update your prometheus.yml configuration to let it scrape the exporter:
scrape_configs:
  - job_name: 'pihole'
    static_configs:
      - targets: ['localhost:9617']
Available CLI options
# Interval of time the exporter will fetch data from PI-Hole
  -interval duration (optional) (default 10s)

# Hostname of the Raspberry PI where PI-Hole is installed
  -pihole_hostname string (optional) (default "127.0.0.1")

# Password defined on the PI-Hole interface
  -pihole_password string (optional)


# WEBPASSWORD / api token defined on the PI-Hole interface at `/etc/pihole/setupVars.conf`
  -pihole_api_token string (optional)

# Port to be used for the exporter
  -port string (optional) (default "9617")
Available Prometheus metrics
| Metric name | Description |
|---|---|
| pihole_domains_being_blocked | This represent the number of domains being blocked |
| pihole_dns_queries_today | This represent the number of DNS queries made over the current day |
| pihole_ads_blocked_today | This represent the number of ads blocked over the current day |
| pihole_ads_percentage_today | This represent the percentage of ads blocked over the current day |
| pihole_unique_domains | This represent the number of unique domains seen |
| pihole_queries_forwarded | This represent the number of queries forwarded |
| pihole_queries_cached | This represent the number of queries cached |
| pihole_clients_ever_seen | This represent the number of clients ever seen |
| pihole_unique_clients | This represent the number of unique clients seen |
| pihole_dns_queries_all_types | This represent the number of DNS queries made for all types |
| pihole_reply | This represent the number of replies made for all types |
| pihole_top_queries | This represent the number of top queries made by PI-Hole by domain |
| pihole_top_ads | This represent the number of top ads made by PI-Hole by domain |
| pihole_top_sources | This represent the number of top sources requests made by PI-Hole by source host |
| pihole_forward_destinations | This represent the number of forward destinations requests made by PI-Hole by destination |
| pihole_querytypes | This represent the number of queries made by PI-Hole by type |
| pihole_status | This represent if PI-Hole is enabled |
Pihole-Exporter Helm Chart
This is a simple Helm Chart to deploy the exporter in a kubernetes cluster.
 Documentation
Documentation

There is no documentation for this package.