 README
README
Apptheus
Apptainer connects Prometheus. A redesigned Prometheus Pushgateway collecting cgroup metrics.
Background
Prometheus is an open source metrics collections and monitoring tool that is widely adopted.
Note: Promethues only supports pull model, meaning that Promethues will regularly (
scrape_interval = x) pull data from metrics sources. If users want to push data to Prometheus, then metric cache components, such as Pushgateway, is needed. See https://prometheus.io/blog/2016/07/23/pull-does-not-scale-or-does-it/.
Pushgateway acts as a bridge (metric caches, metric sources) to Prometheus targeting at the support of both push and pull metrics. For those short-lived jobs or jobs that can not expose metrics themselves. Pushgateway provides an easy way (http rest endpoints) to receive metrics from such jobs, at the same time, Prometheus can pull metrics data from Pushgateway and use it as the metric source.
Pushgateway acts a bit of similar to Prometheus exporters https://prometheus.io/docs/instrumenting/exporters/, but Pushgateway is more general and can receive pushed metrics, while exporters are more specialized and do not support pushing metrics.
When to use Pushgateway (https://prometheus.io/docs/practices/pushing/)
Common Prometheus Architecture
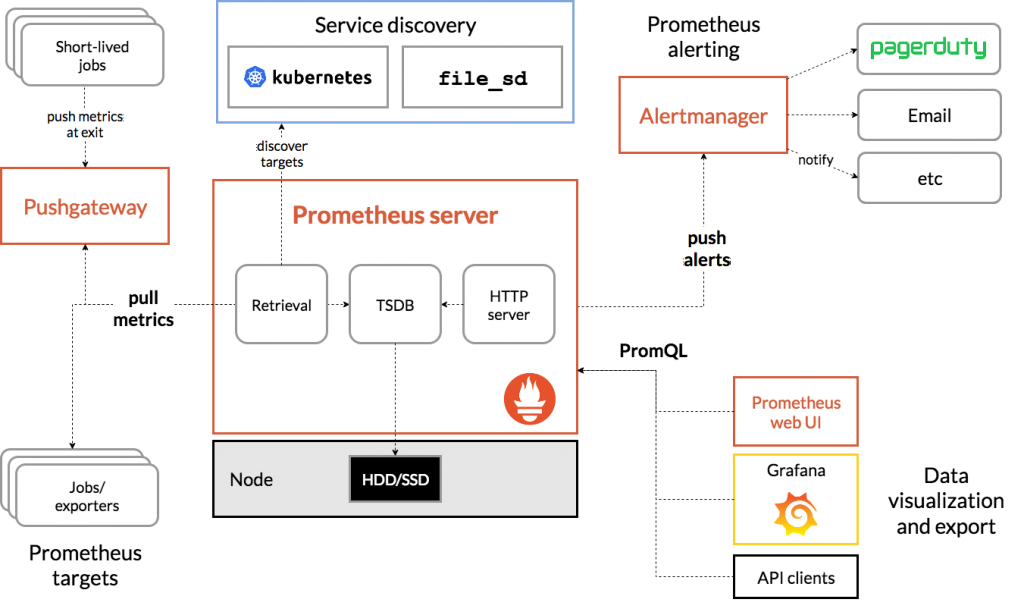
Referenced from https://www.devopsschool.com/blog/what-is-prometheus-and-how-it-works/
When we are thinking to collect metrics from Apptainer, several requirements should be satisfied:
- Less invasion. We do not want to develop a tool that is tightly bound to Apptainer, bringing too much invasion to Apptainer itself.
- Cgroup stats. We want to use existing Linux feature for metrics collection.
- Security. Customized security policy that can help verify whether the caller is trusted.
- Customized push policy. Can freely configure the push interval to sample container metrics.
To collect Apptainer containers stats data, for each created container the starter (starter-suid) process should be put into a newly created sub cgroup so that cgroup stats can be collected and visualized.
Note that this tool can be used for monitoring any programs, this tool comes from the development of one Apptainer RFE.
Changes
- Disabled the default Pushgateway's endpoints for security purpose, so users can not directly push the data to Apptheus. Push can only be called via internal function calls.
- Any connections through the verification unix socket will be verified (Check whether the process is trusted).
- Apptheus can manipulate the cgroup, create new cgroup, add a process into cgroup, remove cgroup and also collect cgroup stats.
- Apptheus will actively monitor the cgroup stats and save the collected stats data.
- The only available endpoint is:
GET /metrics
Note that Apptheus should be started with privileges, which means the unix socket created by Apptheus is also privileged, so during the implementation, the permission of this newly created unix socket is changed to
0o777, that is also the reason why we need to do additional security check, i.e., checking whether the program is trusted.
Differences between Apptheus and Pushgateway
- Pushgateway mainly works in passive mode, waiting for applications to push metrics. While Apptheus actively monitors the cgroup stats and pushes metrics to itself. In terms of metrics expose for Prometheus, they both work in the same way, i.e., exposing
/metricsendpoint to Prometheus. - Pushgateway receives push requests from http endpoints. Apptheus does not receive push requests, Apptheus itself will add the process into a newly created cgroup and collect the cgroup stats.
- Apptheus receives verification through local socket, and verifies the process using its pid and
--trust.pathoptions. While Pushgateway use http tls.
Apptainer uses Apptheus

https://github.com/apptainer/apptheus/assets/2051711/b33c5f20-a030-4b91-a6a7-bc62fe1fc6b8
Important CLI Options
--socket.path="/run/apptheus/gateway.sock", local socket path for verification. Default value is/run/apptheus/gateway.sock.--trust.path="", multiple trusted program paths separated using ';', for exmaple, for apptainer starter, the path usually is/usr/local/libexec/apptainer/bin/starter.--monitor.inverval=0.5s, cgroup stat sample interval.
Additional Info
- Presentations on custom metrics with Pushgateway, Prometheus and Grafana (By Nokia) https://youtu.be/w_jvj0QKrec?si=9ykBj0U03J-b0Z6m&t=2001
- Getting Started with Amazon Managed Service for Prometheus. Amazon has provided users with managed services for Prometheus, allowing users to collect metrics for their containers. https://aws.amazon.com/blogs/mt/getting-started-amazon-managed-service-for-prometheus/
- Other tools also uses Pushgateway and Prometheus
- https://doc.arroyo.dev/introduction#metrics
- https://deckhouse.io/documentation/v1.49/modules/303-prometheus-pushgateway/examples.html
- https://docs.dapr.io/operations/observability/metrics/prometheus/
- Other tech blogs
- Monitoring dashboard for AWS ParallelCluster. https://noise.getoto.net/tag/aws-parallelcluster/
- Springboot Actuator marks Prometheus as production ready feature. https://docs.spring.io/spring-boot/docs/current/reference/html/actuator.html
- Prometheus Monitoring at Scale: War Stories from the GumGum Trenches. https://medium.com/gumgum-tech/prometheus-monitoring-at-scale-war-stories-from-the-gumgum-trenches-f66393c52d0a
- Pushgateway and Prometheus Transform Data Collection and Analysis. https://www.cloudthat.com/resources/blog/pushgateway-and-prometheus-transform-data-collection-and-analysis
 Documentation
Documentation

There is no documentation for this package.
 Directories
Directories
| Path | Synopsis |
|---|---|
|
internal
|
|
|
cgroup
SPDX-FileCopyrightText: Copyright (c) 2023, CIQ, Inc.
|
SPDX-FileCopyrightText: Copyright (c) 2023, CIQ, Inc. |
|
monitor
SPDX-FileCopyrightText: Copyright (c) 2023, CIQ, Inc.
|
SPDX-FileCopyrightText: Copyright (c) 2023, CIQ, Inc. |
|
network
SPDX-FileCopyrightText: Copyright (c) 2023, CIQ, Inc.
|
SPDX-FileCopyrightText: Copyright (c) 2023, CIQ, Inc. |
|
push
SPDX-FileCopyrightText: Copyright (c) 2023, CIQ, Inc.
|
SPDX-FileCopyrightText: Copyright (c) 2023, CIQ, Inc. |
|
util
SPDX-FileCopyrightText: Copyright (c) 2023, CIQ, Inc.
|
SPDX-FileCopyrightText: Copyright (c) 2023, CIQ, Inc. |