 README
README
Prometheus

![]()
![]()
使用CircleCI进程CI Pipeline校验,Go Report Card进行Golang项目代码分析
- CircleCI: https://circleci.com/gh/chenguolin/go-prometheus/tree/master
- Go Report Card: https://goreportcard.com/report/github.com/chenguolin/go-prometheus
golang prometheus API封装, prometheus支持4种Metrics类型
- Counter/CounterVec: 使用NewCounter创建counter metrics, 使用Add来增加metrics数值
- Gauge/GaugeVec: 使用NewGauge创建gauage metrics,使用Set来设置metrics数值
- Histogram/HistogramVec: 使用NewHistogram创建Histogram metrics,使用Observe来设置metrics数值
- Summary/SummaryVec: 使用NewSummary创建Summary metrics,使用Observe来设置metrics数值
Usage
只需要引用了当前package,prometheus client内部会自动生成以下几个服务本身监控metrics,内部会自动起一个HTTP Server,端口默认使用28888
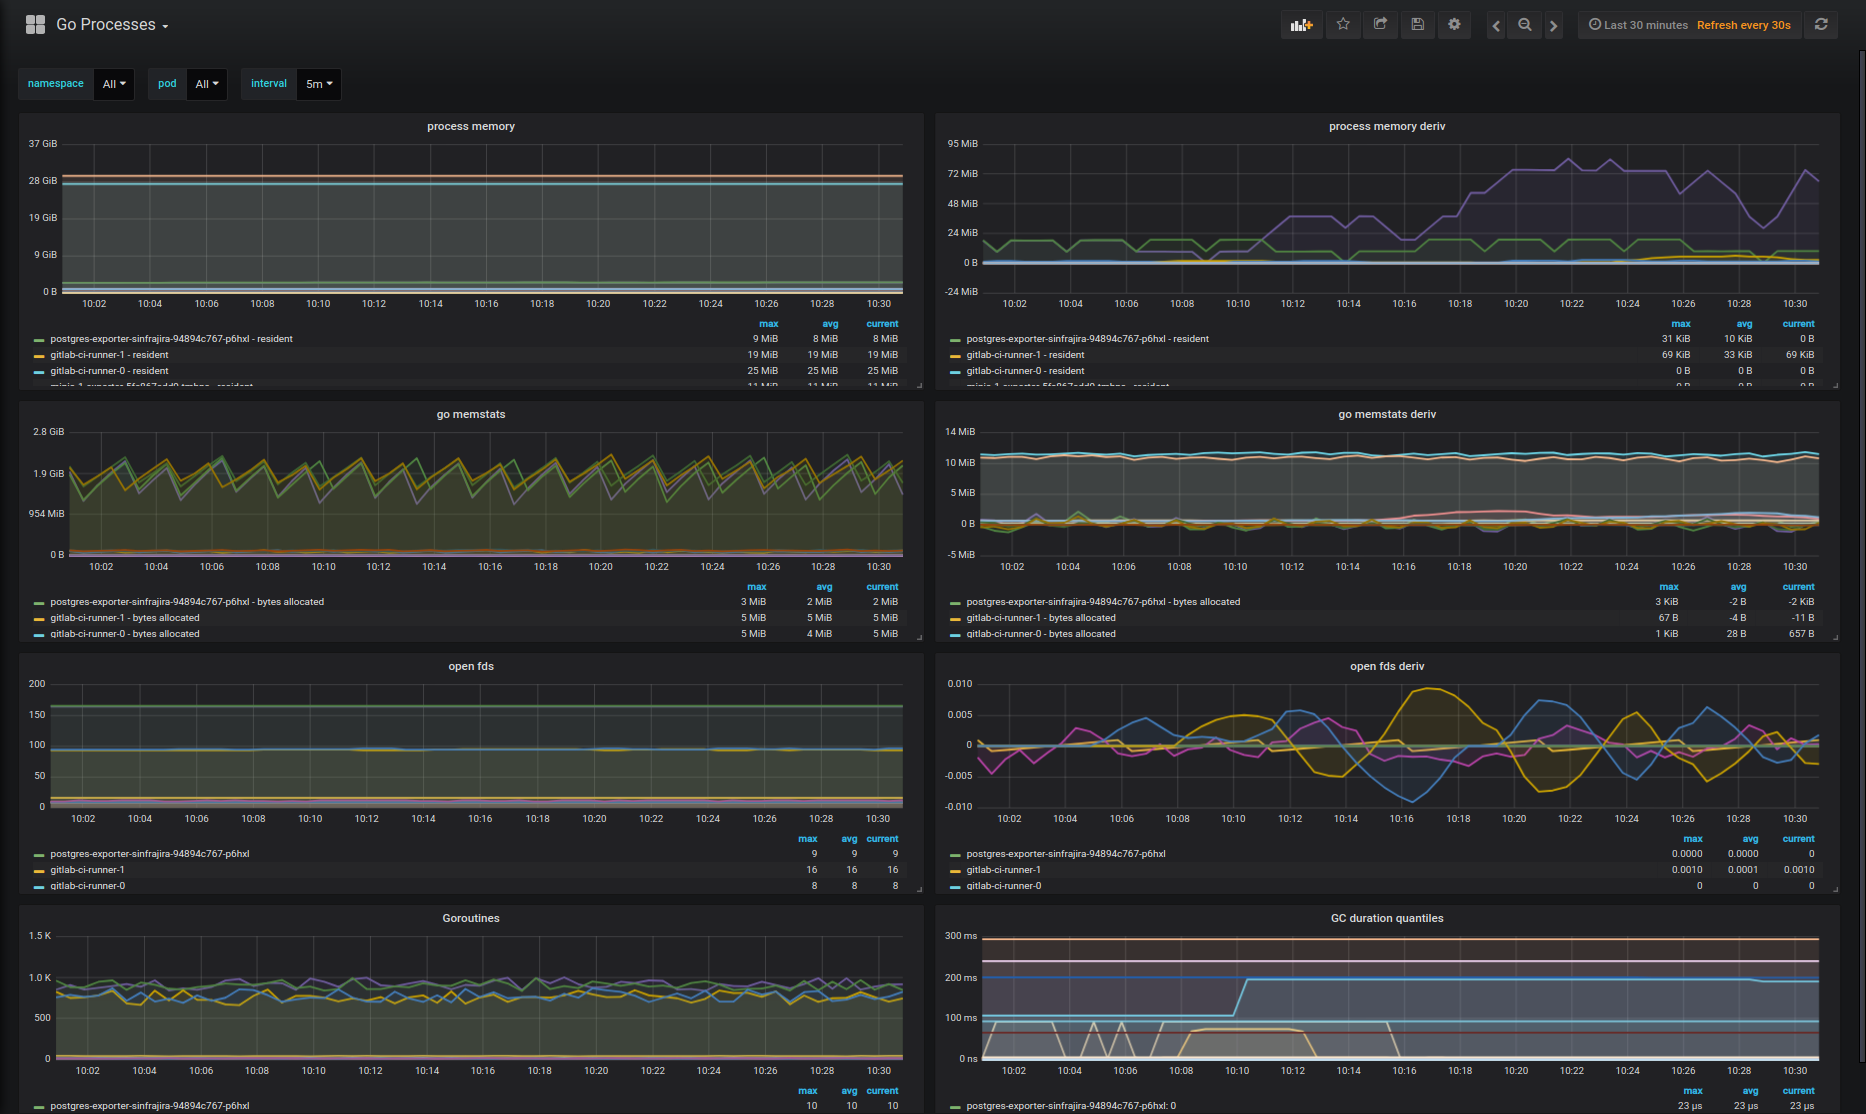
这些指标可以通过Grafana进行展示分析,主要包括以下3个部分
- Goroutine监控
- go_goroutines
- go_threads
- 内存分配监控
- go_memstats_alloc_bytes
- go_memstats_alloc_bytes_total
- go_memstats_buck_hash_sys_bytes
- go_memstats_frees_total
- go_memstats_gc_cpu_fraction ...
- GC监控
- go_gc_duration_seconds
- go_gc_duration_seconds_sum
- go_gc_duration_seconds_count
- Go信息
- go_info
grafana
这些metrics可以使用Grafana进行展示,已经有现成的dashbord的配置可以直接使用,参考 Go process monitor by prometheus 和 Go Runtime monitor by prometheus
metrics
# HELP go_gc_duration_seconds A summary of the GC invocation durations.
# TYPE go_gc_duration_seconds summary
go_gc_duration_seconds{quantile="0"} 0
go_gc_duration_seconds{quantile="0.25"} 0
go_gc_duration_seconds{quantile="0.5"} 0
go_gc_duration_seconds{quantile="0.75"} 0
go_gc_duration_seconds{quantile="1"} 0
go_gc_duration_seconds_sum 0
go_gc_duration_seconds_count 0

# HELP go_goroutines Number of goroutines that currently exist.
# TYPE go_goroutines gauge
go_goroutines 12

# HELP go_info Information about the Go environment.
# TYPE go_info gauge
go_info{version="go1.11.4"} 1

# HELP go_memstats_alloc_bytes Number of bytes allocated and still in use.
# TYPE go_memstats_alloc_bytes gauge
go_memstats_alloc_bytes 1.38176e+06
# HELP go_memstats_alloc_bytes_total Total number of bytes allocated, even if freed.
# TYPE go_memstats_alloc_bytes_total counter
go_memstats_alloc_bytes_total 1.38176e+06
# HELP go_memstats_buck_hash_sys_bytes Number of bytes used by the profiling bucket hash table.
# TYPE go_memstats_buck_hash_sys_bytes gauge
go_memstats_buck_hash_sys_bytes 3488
# HELP go_memstats_frees_total Total number of frees.
# TYPE go_memstats_frees_total counter
go_memstats_frees_total 606
# HELP go_memstats_gc_cpu_fraction The fraction of this program's available CPU time used by the GC since the program started.
# TYPE go_memstats_gc_cpu_fraction gauge
go_memstats_gc_cpu_fraction 0
# HELP go_memstats_gc_sys_bytes Number of bytes used for garbage collection system metadata.
# TYPE go_memstats_gc_sys_bytes gauge
go_memstats_gc_sys_bytes 2.234368e+06
# HELP go_memstats_heap_alloc_bytes Number of heap bytes allocated and still in use.
# TYPE go_memstats_heap_alloc_bytes gauge
go_memstats_heap_alloc_bytes 1.38176e+06
# HELP go_memstats_heap_idle_bytes Number of heap bytes waiting to be used.
# TYPE go_memstats_heap_idle_bytes gauge
go_memstats_heap_idle_bytes 6.3905792e+07
# HELP go_memstats_heap_inuse_bytes Number of heap bytes that are in use.
# TYPE go_memstats_heap_inuse_bytes gauge
go_memstats_heap_inuse_bytes 2.74432e+06
# HELP go_memstats_heap_objects Number of allocated objects.
# TYPE go_memstats_heap_objects gauge
go_memstats_heap_objects 9660
# HELP go_memstats_heap_released_bytes Number of heap bytes released to OS.
# TYPE go_memstats_heap_released_bytes gauge
go_memstats_heap_released_bytes 0
# HELP go_memstats_heap_sys_bytes Number of heap bytes obtained from system.
# TYPE go_memstats_heap_sys_bytes gauge
go_memstats_heap_sys_bytes 6.6650112e+07
# HELP go_memstats_last_gc_time_seconds Number of seconds since 1970 of last garbage collection.
# TYPE go_memstats_last_gc_time_seconds gauge
go_memstats_last_gc_time_seconds 0
# HELP go_memstats_lookups_total Total number of pointer lookups.
# TYPE go_memstats_lookups_total counter
go_memstats_lookups_total 0
# HELP go_memstats_mallocs_total Total number of mallocs.
# TYPE go_memstats_mallocs_total counter
go_memstats_mallocs_total 10266
# HELP go_memstats_mcache_inuse_bytes Number of bytes in use by mcache structures.
# TYPE go_memstats_mcache_inuse_bytes gauge
go_memstats_mcache_inuse_bytes 6912
# HELP go_memstats_mcache_sys_bytes Number of bytes used for mcache structures obtained from system.
# TYPE go_memstats_mcache_sys_bytes gauge
go_memstats_mcache_sys_bytes 16384
# HELP go_memstats_mspan_inuse_bytes Number of bytes in use by mspan structures.
# TYPE go_memstats_mspan_inuse_bytes gauge
go_memstats_mspan_inuse_bytes 40432
# HELP go_memstats_mspan_sys_bytes Number of bytes used for mspan structures obtained from system.
# TYPE go_memstats_mspan_sys_bytes gauge
go_memstats_mspan_sys_bytes 49152
# HELP go_memstats_next_gc_bytes Number of heap bytes when next garbage collection will take place.
# TYPE go_memstats_next_gc_bytes gauge
go_memstats_next_gc_bytes 4.473924e+06
# HELP go_memstats_other_sys_bytes Number of bytes used for other system allocations.
# TYPE go_memstats_other_sys_bytes gauge
go_memstats_other_sys_bytes 1.038944e+06
# HELP go_memstats_stack_inuse_bytes Number of bytes in use by the stack allocator.
# TYPE go_memstats_stack_inuse_bytes gauge
go_memstats_stack_inuse_bytes 458752
# HELP go_memstats_stack_sys_bytes Number of bytes obtained from system for stack allocator.
# TYPE go_memstats_stack_sys_bytes gauge
go_memstats_stack_sys_bytes 458752
# HELP go_memstats_sys_bytes Number of bytes obtained from system.
# TYPE go_memstats_sys_bytes gauge
go_memstats_sys_bytes 7.04512e+07

# HELP go_threads Number of OS threads created.
# TYPE go_threads gauge
go_threads 9
CI Workflow Check
gocyclo: 校验代码复杂度gofmt: 校验代码是否都已经格式化golint: 校验代码风格规范是否按照指定标准gosimple: 校验代码是否可以简化govet: 代码静态校验misspell: 校验是否有英文单词拼写错误unused: 校验是否有未使用变量、常量、函数、结构体等gotest: 单元测试校验
Gitlab CI
如果使用Gitlab,也可以通过.gitlab-ci.yml运行Gitlab CI Pipeline,详细介绍请参考下面2篇文章
Click to show internal directories.
Click to hide internal directories.