 README
README
mchart
Go library for static chart generation (SVG/PNG), focused on reports and PDFs.
- Repository:
https://github.com/messiashenrique/mchart - Module:
github.com/messiashenrique/mchart
Installation
go get github.com/messiashenrique/mchart
Quick start
package main

import (
	"os"

	"github.com/messiashenrique/mchart"
)

func main() {
	c := mchart.NewBarChart("Summary", []mchart.BarItem{
		{Label: "Part A", Value: 70},
		{Label: "Part B", Value: 45},
	})
	c.Tipo = mchart.BarTypePercent

	svg, _ := c.RenderSVG()
	_ = os.WriteFile("bar.svg", []byte(svg), 0o644)
}
Chart types
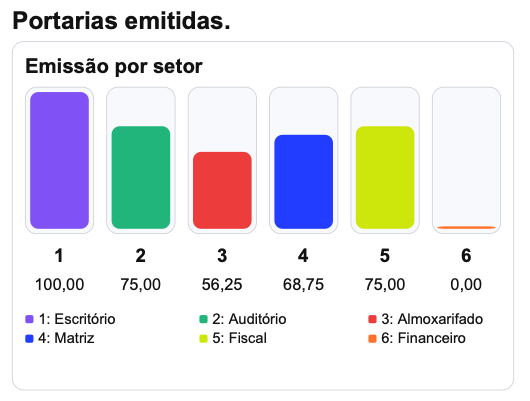
1) ColumnChart
cards := []mchart.ColumnCard{
  {
    Title: "Emissão por setor",
    Bars: []mchart.ColumnBar{
      {Label: "Escritório", Value: 100.0},
      {Label: "Auditório", Value: 75.0},
      {Label: "Almoxarifado", Value: 56.25},
      {Label: "Matriz", Value: 68.75},
      {Label: "Fiscal", Value: 75.0},
      {Label: "Financeiro", Value: 0.0},
    },
  },
}

chart := mchart.NewColumnChart("Portarias emitidas.", cards)
chart.ValueMode = mchart.ValueModeNumber
// chart.ValueMode = mchart.ValueModePercent      // percent values + default palette
// chart.ValueMode = mchart.ValueModePercentColor // percent values + threshold colors
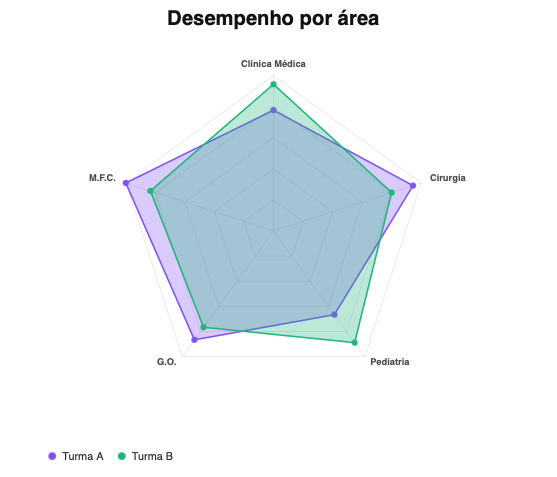
2) SpiderChart
labels := []string{"Clínica Médica", "Cirurgia", "Pediatria", "G.O.", "M.F.C."}
datasets := []mchart.SpiderDataset{
  {Label: "Turma A", Values: []float64{70, 85, 60, 78, 90}},
  {Label: "Turma B", Values: []float64{85, 72, 80, 69, 75}},
}
chart := mchart.NewSpiderChart(labels, datasets)
chart.Title = "Desempenho por área"
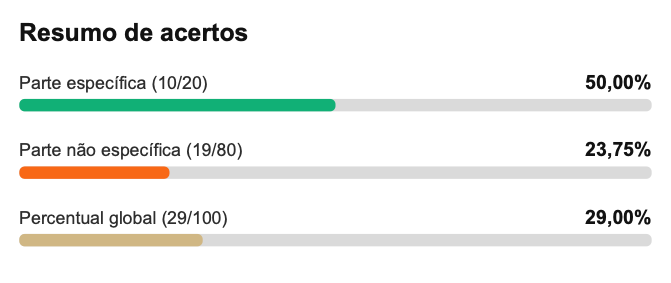
3) BarChart
items := []mchart.BarItem{
  {Label: "Parte específica (10/20)", Value: 50.0, Color: "#10b981"},
  {Label: "Parte não específica (19/80)", Value: 23.75, Color: "#f97316"},
  {Label: "Percentual global (29/100)", Value: 29.0, Color: "#d6bf8f"},
}
chart := mchart.NewBarChart("Resumo de acertos", items)
chart.Tipo = mchart.BarTypePercent
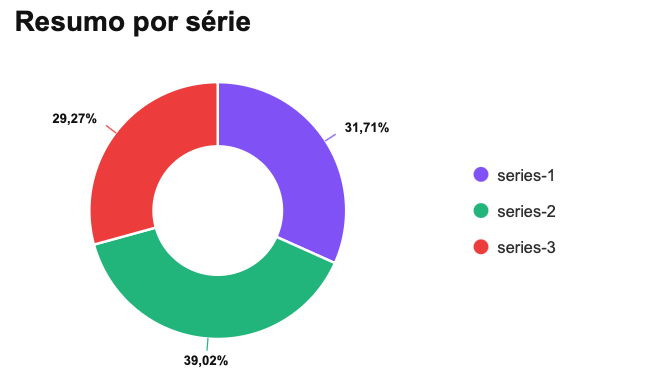
4) DonutChart
slices := []mchart.DonutSlice{
  {Label: "series-1", Value: 26},
  {Label: "series-2", Value: 32},
  {Label: "series-3", Value: 24},
}
chart := mchart.NewDonutChart("Resumo por série", slices)
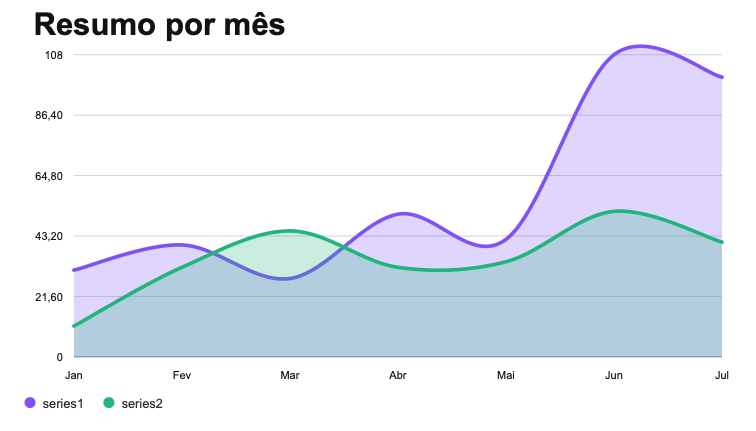
5) SplineChart
labels := []string{"Jan", "Fev", "Mar", "Abr", "Mai", "Jun", "Jul"}
series := []mchart.SplineSeries{
  {Label: "series1", Values: []float64{31, 40, 28, 51, 42, 108, 100}},
  {Label: "series2", Values: []float64{11, 32, 45, 32, 34, 52, 41}},
}
chart := mchart.NewSplineChart("Resumo por mês", labels, series)
chart.Theme = mchart.SplineThemeLight
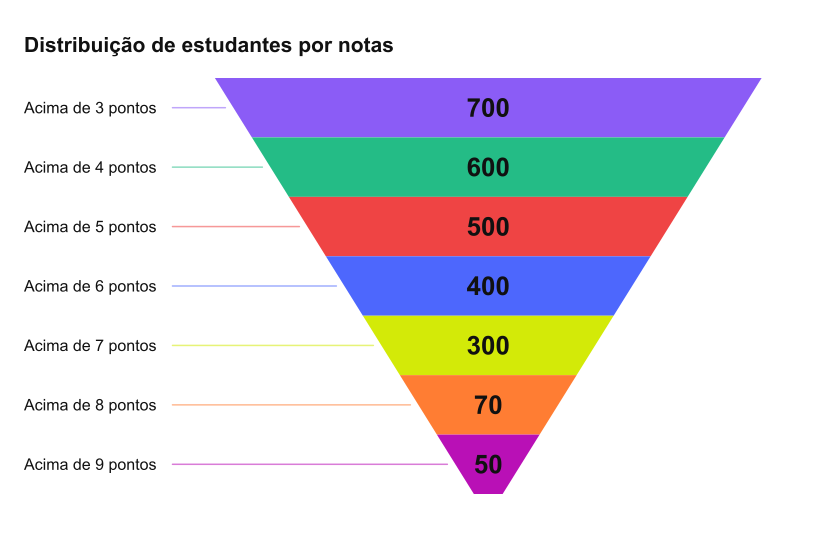
6) FunnelChart
sections := []mchart.FunnelSection{
  {Label: "> 4 pontos", Value: 700},
  {Label: "> de 5 pontos", Value: 600},
  {Label: "> de 6 pontos", Value: 500},
  {Label: "> de 7 pontos", Value: 400},
  {Label: "> de 8 pontos", Value: 300},
  {Label: "> de 9 pontos", Value: 70},
}
chart := mchart.NewFunnelChart("Distribuição de estudantes por notas", sections)
chart.ValueMode = mchart.FunnelValueInteger
chart.Theme = mchart.FunnelThemeLight
Themes and default colors
- Light theme is the default across charts.
- Charts with dark mode support expose
Theme(...ThemeDark). - If no explicit color is provided, the default palette from
colors.gois used.
SVG/PNG output
All charts support:
RenderSVG() (string, error)RenderPNG(opts PNGOptions) ([]byte, error)WriteSVG(path string) errorWritePNG(path string, opts PNGOptions) error
Runnable examples
Generate the 6 demo SVG files:
go run ./examples/all-charts
Generated output: examples/all-charts/out/.
Version
v0.1.5
 Documentation
Documentation
Index 
- Variables
- func RenderPNGFromSVG(svg string, opts PNGOptions) ([]byte, error)
- type BackendAttemptError
- type BarChart
- type BarChartType
- type BarItem
- type BarTheme
- type ColumnBar
- type ColumnCard
- type ColumnChart
- type ColumnLegendPolicy
- type ColumnTheme
- type ColumnValueMode
- type DonutChart
- type DonutSlice
- type DonutTheme
- type FunnelChart
- type FunnelSection
- type FunnelTheme
- type FunnelValueMode
- type PNGBackend
- type PNGOptions
- type PNGRenderError
- type SpiderChart
- type SpiderDataset
- type SpiderTheme
- type SplineChart
- type SplineSeries
- type SplineTheme
Constants 
This section is empty.
Variables 
var (
	ErrEmptySVG          = errors.New("svg output is empty")
	ErrInvalidDimensions = errors.New("invalid output dimensions")
)
Functions 
func RenderPNGFromSVG 
func RenderPNGFromSVG(svg string, opts PNGOptions) ([]byte, error)
Types 
type BackendAttemptError 
type BackendAttemptError struct {
	Backend PNGBackend
	Err     error
}
type BarChart 
type BarChart struct {
	Title      string
	Bars       []BarItem
	Width      int
	MinWidth   int
	Height     int
	Padding    int
	RowGap     int
	ValueMode  BarChartType
	Tipo       BarChartType
	Palette    []string
	ShowZeroAx bool
	Theme      BarTheme
}
BarChart renders horizontal bars for static reports (SVG/PNG).
func NewBarChart 
NewBarChart creates a BarChart with sensible defaults.
type BarChartType 
type BarChartType = ColumnValueMode
const (
	BarTypePercent BarChartType = ValueModePercent
	BarTypeNumber  BarChartType = ValueModeNumber
)
type ColumnCard 
ColumnCard groups bars rendered in one panel of a column chart.
type ColumnChart 
type ColumnChart struct {
	Title        string
	Cards        []ColumnCard
	Width        int
	MinWidth     int
	Height       int
	Padding      int
	CardGap      int
	ValueMode    ColumnValueMode
	LegendPolicy ColumnLegendPolicy
	Palette      []string
	Theme        ColumnTheme
}
ColumnChart renders grouped vertical bars for static reports (SVG/PNG).
func NewColumnChart 
func NewColumnChart(title string, cards []ColumnCard) *ColumnChart
NewColumnChart creates a ColumnChart with sensible defaults.
func (*ColumnChart) RenderPNG 
func (cc *ColumnChart) RenderPNG(opts PNGOptions) ([]byte, error)
func (*ColumnChart) RenderSVG 
func (cc *ColumnChart) RenderSVG() (string, error)
func (*ColumnChart) ToSVG 
func (cc *ColumnChart) ToSVG() string
ToSVG is deprecated and kept for compatibility with previous versions.
func (*ColumnChart) WritePNG 
func (cc *ColumnChart) WritePNG(path string, opts PNGOptions) error
func (*ColumnChart) WriteSVG 
func (cc *ColumnChart) WriteSVG(path string) error
type ColumnLegendPolicy 
type ColumnLegendPolicy string
const (
	LegendAuto   ColumnLegendPolicy = "auto"
	LegendAlways ColumnLegendPolicy = "always"
	LegendNever  ColumnLegendPolicy = "never"
)
type ColumnTheme 
type ColumnTheme string
const (
	ColumnThemeLight ColumnTheme = "light"
	ColumnThemeDark  ColumnTheme = "dark"
)
type ColumnValueMode 
type ColumnValueMode string
const (
	ValueModePercent      ColumnValueMode = "percent"
	ValueModeNumber       ColumnValueMode = "number"
	ValueModePercentColor ColumnValueMode = "percent_color"
)
type DonutChart 
type DonutChart struct {
	Title   string
	Slices  []DonutSlice
	Width   int
	Height  int
	Padding int
	Palette []string
	Theme   DonutTheme
}
DonutChart renders donut/pie-like charts for static reports (SVG/PNG).
func NewDonutChart 
func NewDonutChart(title string, slices []DonutSlice) *DonutChart
NewDonutChart creates a DonutChart with sensible defaults.
func (*DonutChart) RenderPNG 
func (dc *DonutChart) RenderPNG(opts PNGOptions) ([]byte, error)
func (*DonutChart) RenderSVG 
func (dc *DonutChart) RenderSVG() (string, error)
func (*DonutChart) ToSVG 
func (dc *DonutChart) ToSVG() string
ToSVG is deprecated and kept for compatibility with previous versions.
func (*DonutChart) WritePNG 
func (dc *DonutChart) WritePNG(path string, opts PNGOptions) error
func (*DonutChart) WriteSVG 
func (dc *DonutChart) WriteSVG(path string) error
type DonutSlice 
DonutSlice represents one segment of a donut chart.
type DonutTheme 
type DonutTheme string
const (
	DonutThemeLight DonutTheme = "light"
	DonutThemeDark  DonutTheme = "dark"
)
type FunnelChart ¶ added in v0.1.4
type FunnelChart struct {
	Title             string
	Sections          []FunnelSection
	Width             int
	Height            int
	Padding           int
	Palette           []string
	Theme             FunnelTheme
	ValueMode         FunnelValueMode
	ShowLegendConnect bool
}
FunnelChart renders stacked trapezoid funnel sections (SVG/PNG).
func NewFunnelChart ¶ added in v0.1.4
func NewFunnelChart(title string, sections []FunnelSection) *FunnelChart
NewFunnelChart creates a FunnelChart with sensible defaults.
func (*FunnelChart) RenderPNG ¶ added in v0.1.4
func (fc *FunnelChart) RenderPNG(opts PNGOptions) ([]byte, error)
func (*FunnelChart) RenderSVG ¶ added in v0.1.4
func (fc *FunnelChart) RenderSVG() (string, error)
func (*FunnelChart) ToSVG ¶ added in v0.1.4
func (fc *FunnelChart) ToSVG() string
ToSVG is deprecated and kept for compatibility with previous versions.
func (*FunnelChart) WritePNG ¶ added in v0.1.4
func (fc *FunnelChart) WritePNG(path string, opts PNGOptions) error
func (*FunnelChart) WriteSVG ¶ added in v0.1.4
func (fc *FunnelChart) WriteSVG(path string) error
type FunnelSection ¶ added in v0.1.4
FunnelSection represents one stage of a funnel chart.
type FunnelTheme ¶ added in v0.1.4
type FunnelTheme string
const (
	FunnelThemeLight FunnelTheme = "light"
	FunnelThemeDark  FunnelTheme = "dark"
)
type FunnelValueMode ¶ added in v0.1.4
type FunnelValueMode string
const (
	FunnelValueFloat   FunnelValueMode = "float"
	FunnelValueInteger FunnelValueMode = "integer"
)
type PNGBackend 
type PNGBackend string
const (
	PNGBackendAuto   PNGBackend = "auto"
	PNGBackendRSVG   PNGBackend = "rsvg"
	PNGBackendCanvas PNGBackend = "canvas"
)
type PNGOptions 
type PNGOptions struct {
	Width      int
	Height     int
	Scale      float64
	Background string
	Backend    PNGBackend
}
type PNGRenderError 
type PNGRenderError struct {
	Attempts []BackendAttemptError
}
func (*PNGRenderError) Error 
func (e *PNGRenderError) Error() string
func (*PNGRenderError) Unwrap 
func (e *PNGRenderError) Unwrap() error
Unwrap returns the first backend error to enable errors.Is/errors.As checks.
type SpiderChart 
type SpiderChart struct {
	Title    string
	Labels   []string
	Datasets []SpiderDataset
	Max      *float64
	Levels   int
	Size     int
	Padding  int
	Theme    SpiderTheme
}
SpiderChart renders a radar/spider chart for static reports (SVG/PNG).
func NewSpiderChart 
func NewSpiderChart(labels []string, datasets []SpiderDataset) *SpiderChart
NewSpiderChart creates a SpiderChart with sensible defaults.
func (*SpiderChart) RenderPNG 
func (sc *SpiderChart) RenderPNG(opts PNGOptions) ([]byte, error)
func (*SpiderChart) RenderSVG 
func (sc *SpiderChart) RenderSVG() (string, error)
func (*SpiderChart) ToSVG 
func (sc *SpiderChart) ToSVG() string
ToSVG is deprecated and kept for compatibility with previous versions.
func (*SpiderChart) WritePNG 
func (sc *SpiderChart) WritePNG(path string, opts PNGOptions) error
func (*SpiderChart) WriteSVG 
func (sc *SpiderChart) WriteSVG(path string) error
type SpiderDataset 
SpiderDataset defines one series on the radar/spider chart.
type SpiderTheme 
type SpiderTheme string
const (
	SpiderThemeLight SpiderTheme = "light"
	SpiderThemeDark  SpiderTheme = "dark"
)
type SplineChart 
type SplineChart struct {
	Title      string
	Labels     []string
	Series     []SplineSeries
	Width      int
	Height     int
	Padding    int
	Max        *float64
	Palette    []string
	Theme      SplineTheme
	ShowPoints bool
}
SplineChart renders smoothed line charts with area under the curve (SVG/PNG).
func NewSplineChart 
func NewSplineChart(title string, labels []string, series []SplineSeries) *SplineChart
NewSplineChart creates a SplineChart with sensible defaults.
func (*SplineChart) RenderPNG 
func (sc *SplineChart) RenderPNG(opts PNGOptions) ([]byte, error)
func (*SplineChart) RenderSVG 
func (sc *SplineChart) RenderSVG() (string, error)
func (*SplineChart) ToSVG 
func (sc *SplineChart) ToSVG() string
ToSVG is deprecated and kept for compatibility with previous versions.
func (*SplineChart) WritePNG 
func (sc *SplineChart) WritePNG(path string, opts PNGOptions) error
func (*SplineChart) WriteSVG 
func (sc *SplineChart) WriteSVG(path string) error
type SplineSeries 
SplineSeries defines one line/area dataset on a spline chart.
type SplineTheme 
type SplineTheme string
const (
	SplineThemeLight SplineTheme = "light"
	SplineThemeDark  SplineTheme = "dark"
)