

 README

README

prom-analytics-proxy


Table of Contents
Overview
prom-analytics-proxy is a powerful observability tool that acts as a transparent proxy between your Prometheus server and its clients. It provides deep insights into your PromQL query patterns, helping you optimize performance and resource usage while maintaining complete visibility into your monitoring stack.
Watch the Introduction Video
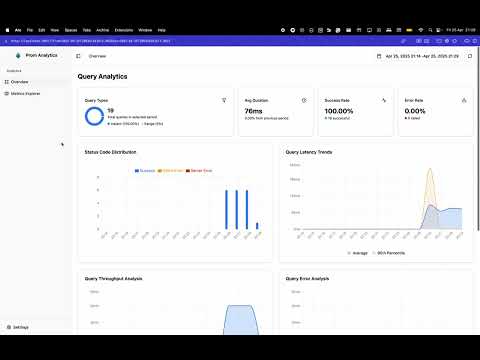
Learn how prom-analytics-proxy can help you gain insights into your Prometheus queries and optimize your monitoring setup.
Quick Start
# Clone the repository
git clone https://github.com/nicolastakashi/prom-analytics-proxy.git
cd prom-analytics-proxy

# Build and run
make build
./prom-analytics-proxy -upstream http://your-prometheus-server:9090
Features
Query Analytics
- Detailed statistics on PromQL queries
- Execution time tracking
- Resource consumption metrics
- Series count analysis
Metrics Usage
- Integration with Perses Metrics Usage
- Multi-source data correlation
- Comprehensive metrics tracking
- Learn more about Metrics Usage Integration
Data Storage
- PostgreSQL support
- SQLite support
- Flexible storage options
- Efficient data management
User Interface
- Intuitive web-based dashboard
- Query performance visualization
- Query Shortcuts for common patterns
- Real-time analytics
Project Structure
The project is organized into two main components:
Backend (prom-analytics-proxy)
- Go-based proxy application
- Query analytics collection
- Performance metrics processing
- Data storage management
Frontend (prom-analytics-proxy-ui)
- React-based user interface
- Data visualization
- Query analysis tools
- Interactive dashboards
Configuration
The application can be configured through command-line flags or a configuration file. Here are the key configuration options:
Basic Configuration
# Example configuration
upstream: "http://prometheus:9090"
insecure-listen-address: ":9091"
database-provider: "postgresql" # or "sqlite"
Database Configuration
# PostgreSQL
postgresql-addr: "localhost"
postgresql-port: 5432
postgresql-database: "prom_analytics"
postgresql-user: "user"
postgresql-password: "password"

# SQLite
sqlite-database-path: "prom-analytics-proxy.db"
Performance Tuning
insert-batch-size: 10
insert-buffer-size: 100
insert-flush-interval: "5s"
insert-grace-period: "5s"
insert-timeout: "1s"
  -config-file string
    	Path to the configuration file, it takes precedence over the command line flags.
  -database-provider string
    	The provider of database to use for storing query data. Supported values: postgresql, sqlite.
  -include-query-stats
    	Request query stats from the upstream prometheus API. (default true)
  -insecure-listen-address string
    	The address the prom-analytics-proxy proxy HTTP server should listen on. (default ":9091")
  -insert-batch-size int
    	Batch size for inserting queries into the database. (default 10)
  -insert-buffer-size int
    	Buffer size for the insert channel. (default 100)
  -insert-flush-interval duration
    	Flush interval for inserting queries into the database. (default 5s)
  -insert-grace-period duration
    	Grace period to insert pending queries after program shutdown. (default 5s)
  -insert-timeout duration
    	Timeout to insert a query into the database. (default 1s)
  -log-format string
    	Log format (text, json) (default "text")
  -log-level string
    	Log level (default "INFO")
  -metadata-limit uint
    	The maximum number of metric metadata entries to retrieve from the upstream prometheus API. (default 0 which means no limit)
  -postgresql-addr string
    	Address of the postgresql server. (default "localhost")
  -postgresql-database string
    	Database for the postgresql server, can also be set via POSTGRESQL_DATABASE env var.
  -postgresql-dial-timeout duration
    	Timeout to dial postgresql. (default 5s)
  -postgresql-password string
    	Password for the postgresql server, can also be set via POSTGRESQL_PASSWORD env var.
  -postgresql-port int
    	Port of the postgresql server. (default 5432)
  -postgresql-sslmode string
    	SSL mode for the postgresql server. (default "disable")
  -postgresql-user string
    	Username for the postgresql server, can also be set via POSTGRESQL_USER env var.
  -series-limit uint
    	The maximum number of series to retrieve from the upstream prometheus API. (default 0 which means no limit)
  -sqlite-database-path string
    	Path to the sqlite database. (default "prom-analytics-proxy.db")
  -upstream string
    	The URL of the upstream prometheus API.
Tracing Support
The prom-analytics-proxy application includes built-in support for distributed tracing using OpenTelemetry. To enable tracing, you must provide a configuration file specifying the tracing settings. Below is an example configuration and details for each option:
tracing:
  client_type: ""
  service_name: ""
  resource_attributes: {}
  reconnection_period: 0s
  compression: ""
  insecure: false
  endpoint: ""
  url_path: ""
  timeout: 0s
  retry_config:
    retry_enabled: false
    retry_initial_interval: 0s
    retry_max_interval: 0s
    retry_max_elapsed_time: 0s
  headers: {}
  tls_config:
    ca_file: ""
    cert_file: ""
    key_file: ""
    server_name: ""
    insecure_skip_verify: false
  sampler_type: ""
  sampler_param: ""
Metrics Usage Integration
The prom-analytics-proxy application integrates with Perses Metrics Usage to gather and correlate metrics usage data from multiple sources. Essentially, prom-analytics-proxy acts as a backend for the Metrics Usage frontend, providing the data needed to populate the UI.
Because Metrics Usage is a separate project, you must deploy it alongside prom-analytics-proxy to enable this feature. Once configured, prom-analytics-proxy sends the collected data to the Metrics Usage backend, which is then displayed in the Metrics Usage UI. For more information, see the Metrics Usage repository.
You can find a sample configuration file for the Metrics Usage integration in the config directory. The file includes the following options, assuming the prom-analytics-proxy is running on `
 Documentation

Documentation


There is no documentation for this package.
 Source Files
 Directories