

 README

README

OpsCart Watcher
Kubectl shows resources. Lens shows state. OpsCart shows what deserves your attention.




Read-only · No agents · No cloud credentials · Deploy in 30 seconds
What in this cluster deserves attention right now?
kubectl    →  shows resources
Grafana    →  shows metrics
Lens       →  shows cluster state
OpsCart    →  shows what deserves attention first
Why OpsCart?
A healthy dashboard does not always mean a healthy cluster.
Metrics tell you whether your services are meeting SLOs. OpsCart tells you which operational problems have quietly accumulated over weeks — crash-looping pods, image pull failures, privileged containers, missing NetworkPolicies, orphaned PVCs, and cost waste — none of which trigger a metrics alert.
This isn't alert aggregation. OpsCart remembers what happened between scans — when a problem was first detected, whether it's been resolved and come back, whether it's getting worse. A pod that's been crash-looping for 11 days and a pod that started crashing 5 minutes ago look identical to a metrics dashboard; they're a completely different problem to OpsCart, because it has a memory and metrics tools don't.
Instead of dozens of dashboards, you get a prioritized list of what deserves attention first — with the history to know why. Designed for platform engineers managing Kubernetes clusters who want fast operational triage without deploying agents or modifying workloads.
Quick Start
Helm (Recommended)
helm install opscart-watcher ./helm/opscart-watcher \
  --namespace opscart-system \
  --create-namespace

kubectl port-forward -n opscart-system svc/opscart-watcher 8080:80
open http://localhost:8080
Incident history persists on a PVC by default — see the chart README for storage options and minikube-specific notes. The raw manifest below is a quickstart; the Helm chart is canonical.
kubectl
kubectl apply -f https://raw.githubusercontent.com/opscart/opscart-k8s-watcher/main/deploy/dashboard.yaml
kubectl port-forward -n opscart-system svc/opscart-watcher 8080:80
open http://localhost:8080
Developer Build
git clone https://github.com/opscart/opscart-k8s-watcher.git
cd opscart-k8s-watcher
go build -o opscart-dashboard ./cmd/opscart-dashboard
./opscart-dashboard --cluster my-cluster --port 8080
First Login
OpsCart requires authentication by default — there is no configuration that disables it. On first run with nothing configured, it generates a random password and prints it once to the pod logs:
kubectl logs deploy/opscart-watcher -n opscart-system | grep "auth:"
Get the user name and password
kubectl get secret opscart-auth -n opscart-system -o jsonpath='{.data.username}' | base64 -d
echo
admin
kubectl get secret opscart-auth -n opscart-system -o jsonpath='{.data.password}' | base64 -d
echo
mypassxxx
You'll see something like:
auth: WARNING — using auto-generated password (see above). Configure OPSCART_AUTH_USER/PASS or OPSCART_AUTH_SECRET_NAME for a stable credential.
auth: username=admin password=x7K9-mQ2p-Rt4w
This password regenerates on every pod restart unless you configure a stable one. For a persistent credential, create a Secret and reference it in values.yaml:
kubectl create secret generic opscart-auth \
  --from-literal=username=admin \
  --from-literal=password=<your-password> \
  -n opscart-system
auth:
  existingSecret: "opscart-auth"
For team deployments, authenticate at the ingress layer instead with oauth2-proxy — supports Azure AD, Google, GitHub, and generic OIDC. See Security for the full pattern and threat model.
Features
Overview
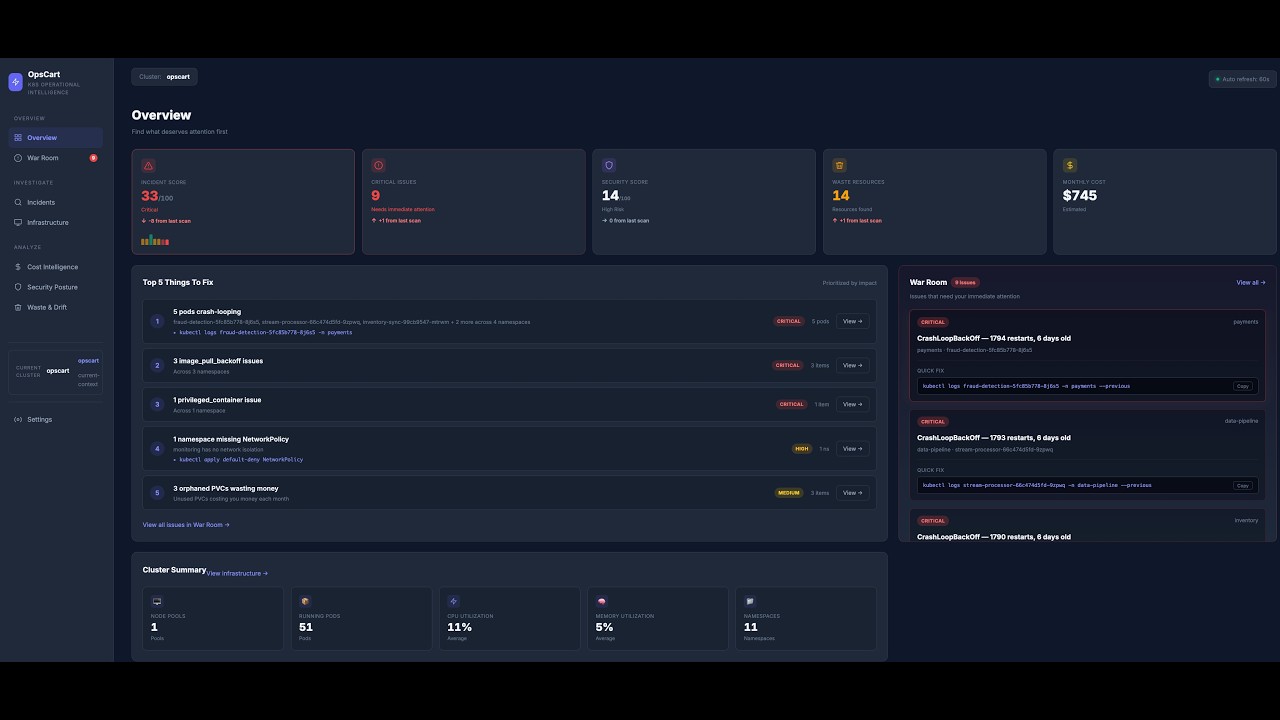
The entry point isn't a KPI grid — it's a written assessment. Situation Briefing states what's actually wrong in plain sentences ("fraud-detection has been crash-looping for 7 days and its restart rate is accelerating"), not a wall of gauges. Below it:
- Operational Memory scoreboard — total incidents ever seen, resolved, reopened, currently accelerating, longest-running incident, most unstable namespace — numbers only possible because OpsCart remembers, not just observes
- Top 5 Things To Fix — ranked by severity and restart rate, each with a memory line (first detected, reopen count, trend) and a direct link to investigate
- Cluster Health, Namespace Health, and Security Status at a glance
No competitor in this space — Grafana, Lens, k9s — can produce any of this, because none of them remember anything between scans.
Operational Triage
Incident Score — A single 0–100 score derived from crash loops, image pull failures, security posture, waste, and network policy gaps. Trend arrows and a 7-point sparkline show whether the cluster is getting better or worse.
War Room — Every critical incident in one view, prioritized by severity and restart rate. Detects crash loops, image pull failures, probe failures (containers repeatedly killed by a failing startup/liveness check before reaching Ready), and privileged containers. Each card shows the issue type, namespace, age, restart count, and a ready-to-run kubectl command. One click opens a full investigation.
Investigation — One click from detection to investigation. Every pod-level incident includes:
- OpsCart Assessment: what the pattern means and estimated investigation time, including whether the restart rate is accelerating
- Incident Timeline: an operational journal — first detected, restart milestones, severity changes, resolved/reoccurred — persisted across pod restarts
- Evidence: severity, first detected, restart count, state, age, owner
- Blast Radius: replicas down, sibling pod health, services routing to the workload, ingress exposure, namespace-wide health, and a customer-impact heuristic (internal vs. possible external traffic)
- Recommended Investigation: numbered steps with High / Medium / Low confidence and specific kubectl commands
- Recent Events: last 10 events filtered to this pod
- Related Resources: ConfigMaps, Secrets, PVCs referenced by the pod spec
Namespace-level findings (unprotected namespaces, idle namespaces) get their own dedicated view — a sample NetworkPolicy and namespace-scoped remediation steps, not a pod investigation that doesn't apply.
Incidents — The full system of record: every incident this cluster has seen, active and resolved. Search by name, namespace, or issue type; filter by severity and status; sorted and paginated. Resolved incidents stay visible with recovery time, so you can see what was broken last week — not just what's broken now.
Operational Insights
Security Posture — CIS Kubernetes Benchmark scoring. Failed controls shown first, risk breakdown by category, prioritized remediation actions.
Waste & Drift — Zombie pods, orphaned PVCs with storage size and age, zero-replica workloads, abandoned namespaces.
Cost Intelligence — Node pool cost breakdown, namespace allocation, reserved instance savings. No cloud credentials needed — Azure pricing is embedded at build time.
Platform
Operational Memory — OpsCart remembers what happened. A lightweight local database tracks cluster snapshots, incident lifecycle (detected → milestones → resolved → reopened) as an append-only event journal, and scan metadata. Powers trend arrows, sparklines, incident age, and the per-incident timeline. Backed by SQLite, persisted on a PVC that survives pod restarts and helm uninstall. Configurable retention (90 days by default) keeps the database from growing unbounded.
Authentication — Basic auth on by default with no disable path: environment variables, a Kubernetes Secret, or an auto-generated password logged at startup. For teams, front it with oauth2-proxy for Azure AD / Google / GitHub / OIDC — see First Login above.
Helm Chart — Full Helm chart with configurable values, PVC-backed persistence, read-only RBAC, and non-root security context. See the chart README for persistence options, minikube notes, and all values.
Agentless — Runs as a single container. No sidecars, no DaemonSets, no node access, no cloud credentials.
Security
| Property | Detail |
|---|---|
| Base image | scratch — no OS, no shell, no package manager |
| User | Non-root (UID 65534) |
| Binary | CGO_ENABLED=0, statically compiled, -trimpath |
| CVE scan | 0 vulnerabilities (Trivy) |
| Cluster permissions | Read-only ClusterRole (get, list only) |
| Mutations | None — never modifies cluster state |
| External calls | None — no telemetry, no phone-home |
| Authentication | Basic auth on by default, no disable path — env var, Secret, or auto-generated password |
# Audit it yourself
trivy image ghcr.io/opscart/opscart-dashboard:latest
kubectl describe clusterrole opscart-dashboard
See docs/05-Security.md for the full threat model and security philosophy.
How It Compares
| Tool | Primary Question |
|---|---|
| kubectl | What resources exist? |
| Lens / k9s | What is running right now? |
| Grafana | Are metrics within thresholds? |
| Kubecost | Where is money being spent? |
| OpsCart | What deserves attention first? |
OpsCart is not a replacement for these tools. It is the triage layer that tells you which questions to ask of your observability stack.
Helm Configuration
See helm/opscart-watcher/README.md for the full values reference, persistence configuration, and environment-specific notes (minikube, multi-node, local images).
CLI Reference
go build -o opscart-scan ./cmd/opscart-scan

./opscart-scan emergency --cluster prod      # War Room from terminal
./opscart-scan security --cluster prod       # CIS scoring
./opscart-scan waste --cluster prod          # Waste detection
./opscart-scan cloud-costs --cluster prod    # Azure cost analysis
./opscart-scan network --cluster prod        # Network policy gaps
./opscart-scan report --cluster prod         # HTML report
Coming Next
- Related incidents (cross-incident correlation — same namespace, shared config/secrets, correlated timing)
- Root cause confidence scoring (deterministic, evidence-based)
- Native OIDC authentication + namespace-scoped authorization (SubjectAccessReview-based)
- Slack and Teams notifications
Disclaimer
Awareness tool — not for formal compliance auditing. Use kube-bench for official CIS compliance. Azure cost estimates are based on public retail pricing and vary with EA/MACC agreements.
Author: Shamsher Khan — opscart.com · IEEE Senior Member · DZone Core Member
License: MIT
 Directories

Directories

| Path | Synopsis |
|---|---|
|
cmd
|
|
|
opscart-dashboard
command
|
|
|
opscart-scan
command
|
|
|
pkg
|
|
|
analyzer
Save this as: pkg/analyzer/cis_scorer.go
|
Save this as: pkg/analyzer/cis_scorer.go |
|
kube
Package kube holds small Kubernetes API helpers shared across scanner and analyzer packages.
|
Package kube holds small Kubernetes API helpers shared across scanner and analyzer packages. |