

 README

README

Grafana Kubernetes Plugin
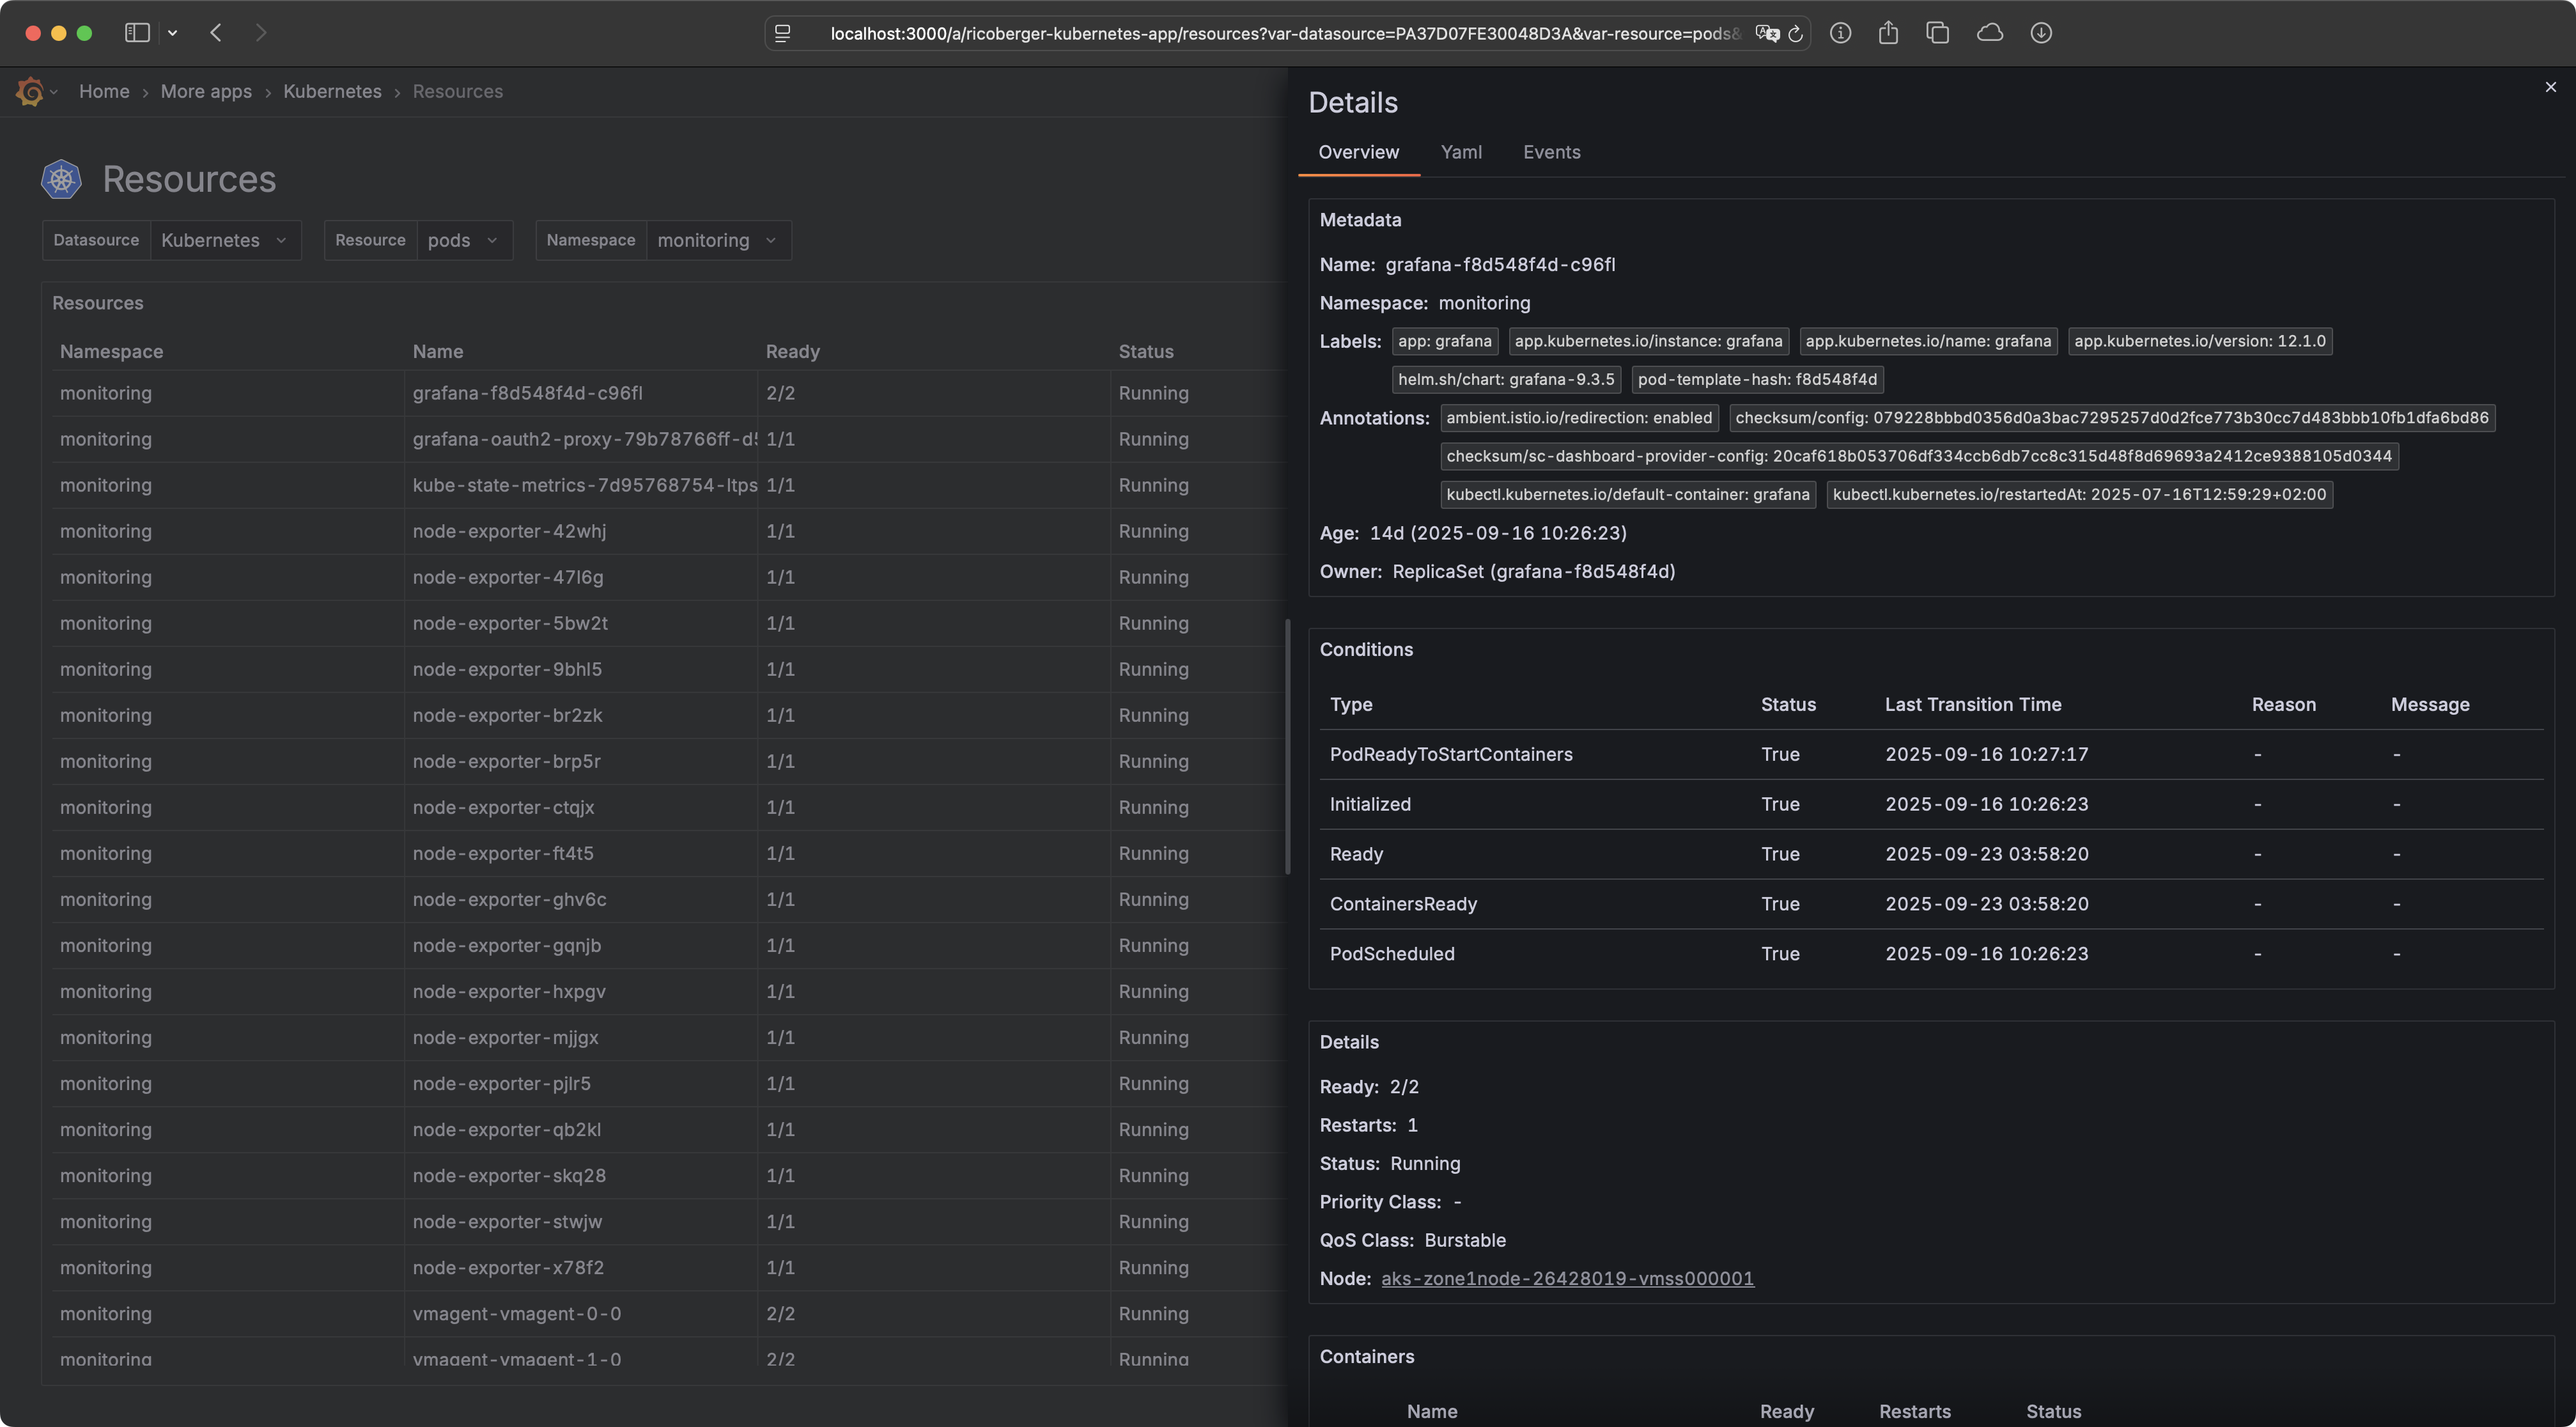
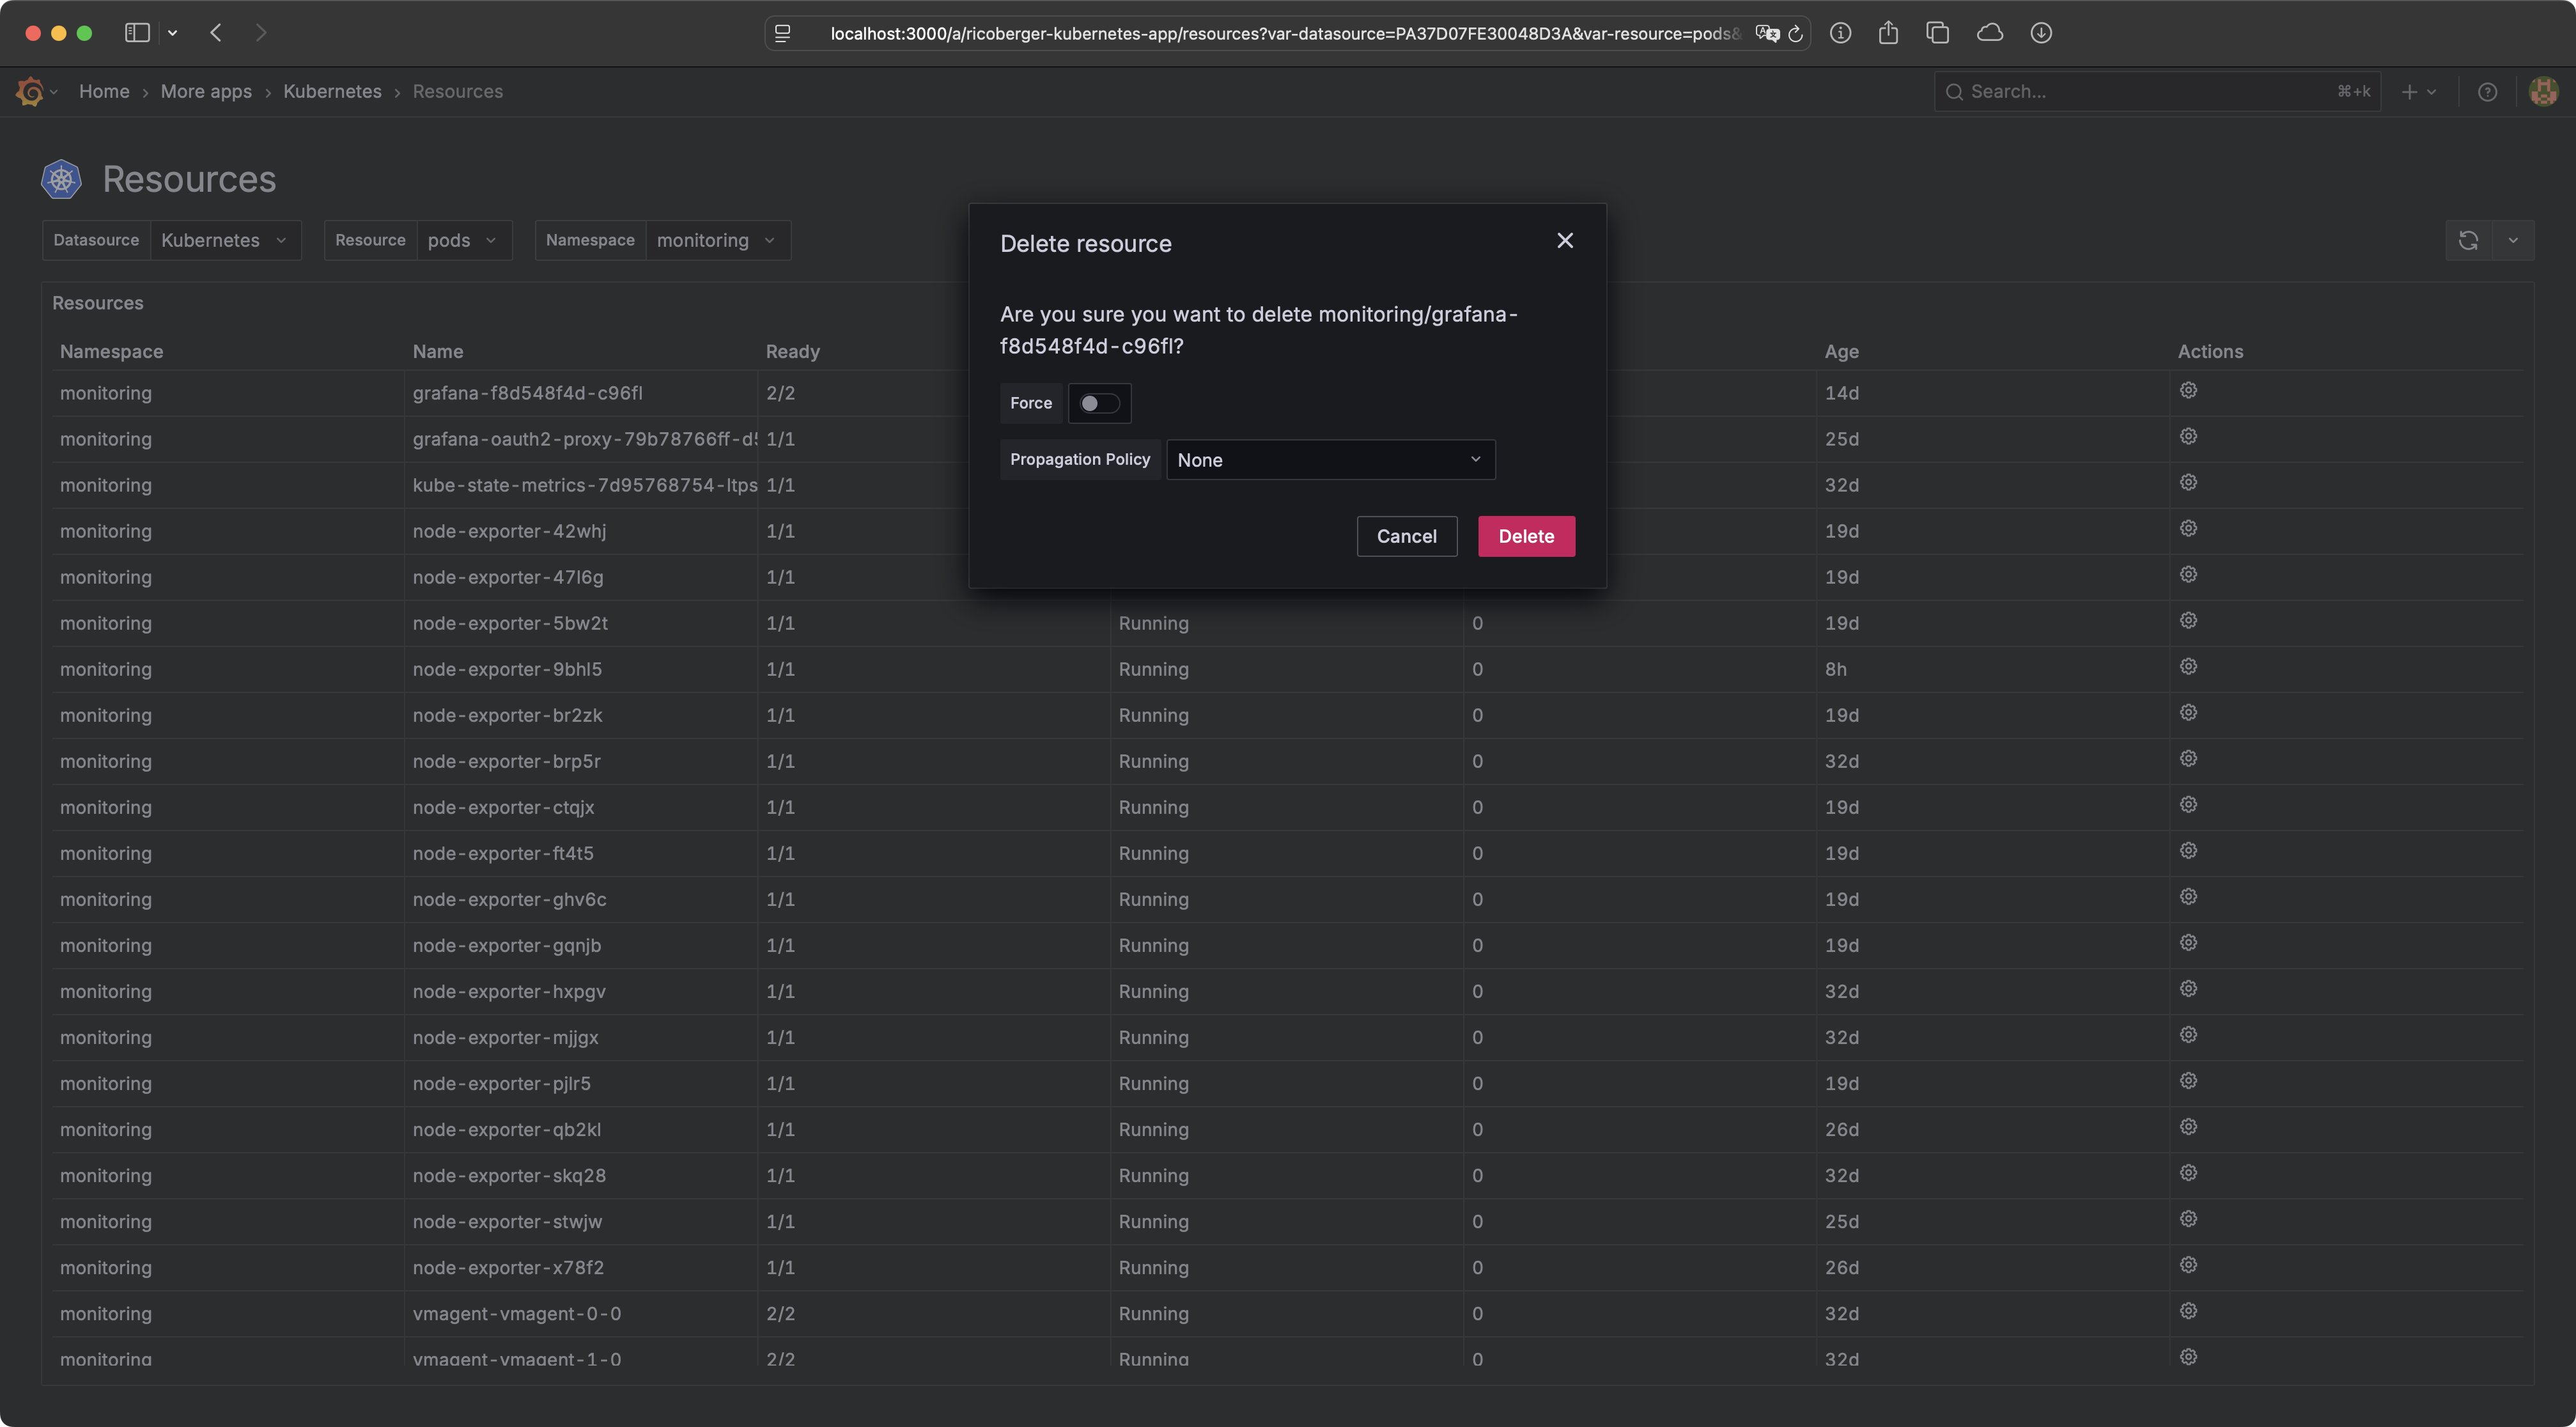
The Grafana Kubernetes Plugin allows you to explore your Kubernetes resources and logs directly within Grafana. The plugin also provides several actions to interact with your resources, including editing, deleting, and scaling them. Last but not least, the plugin also supports other cloud native tools such as Helm and Flux.
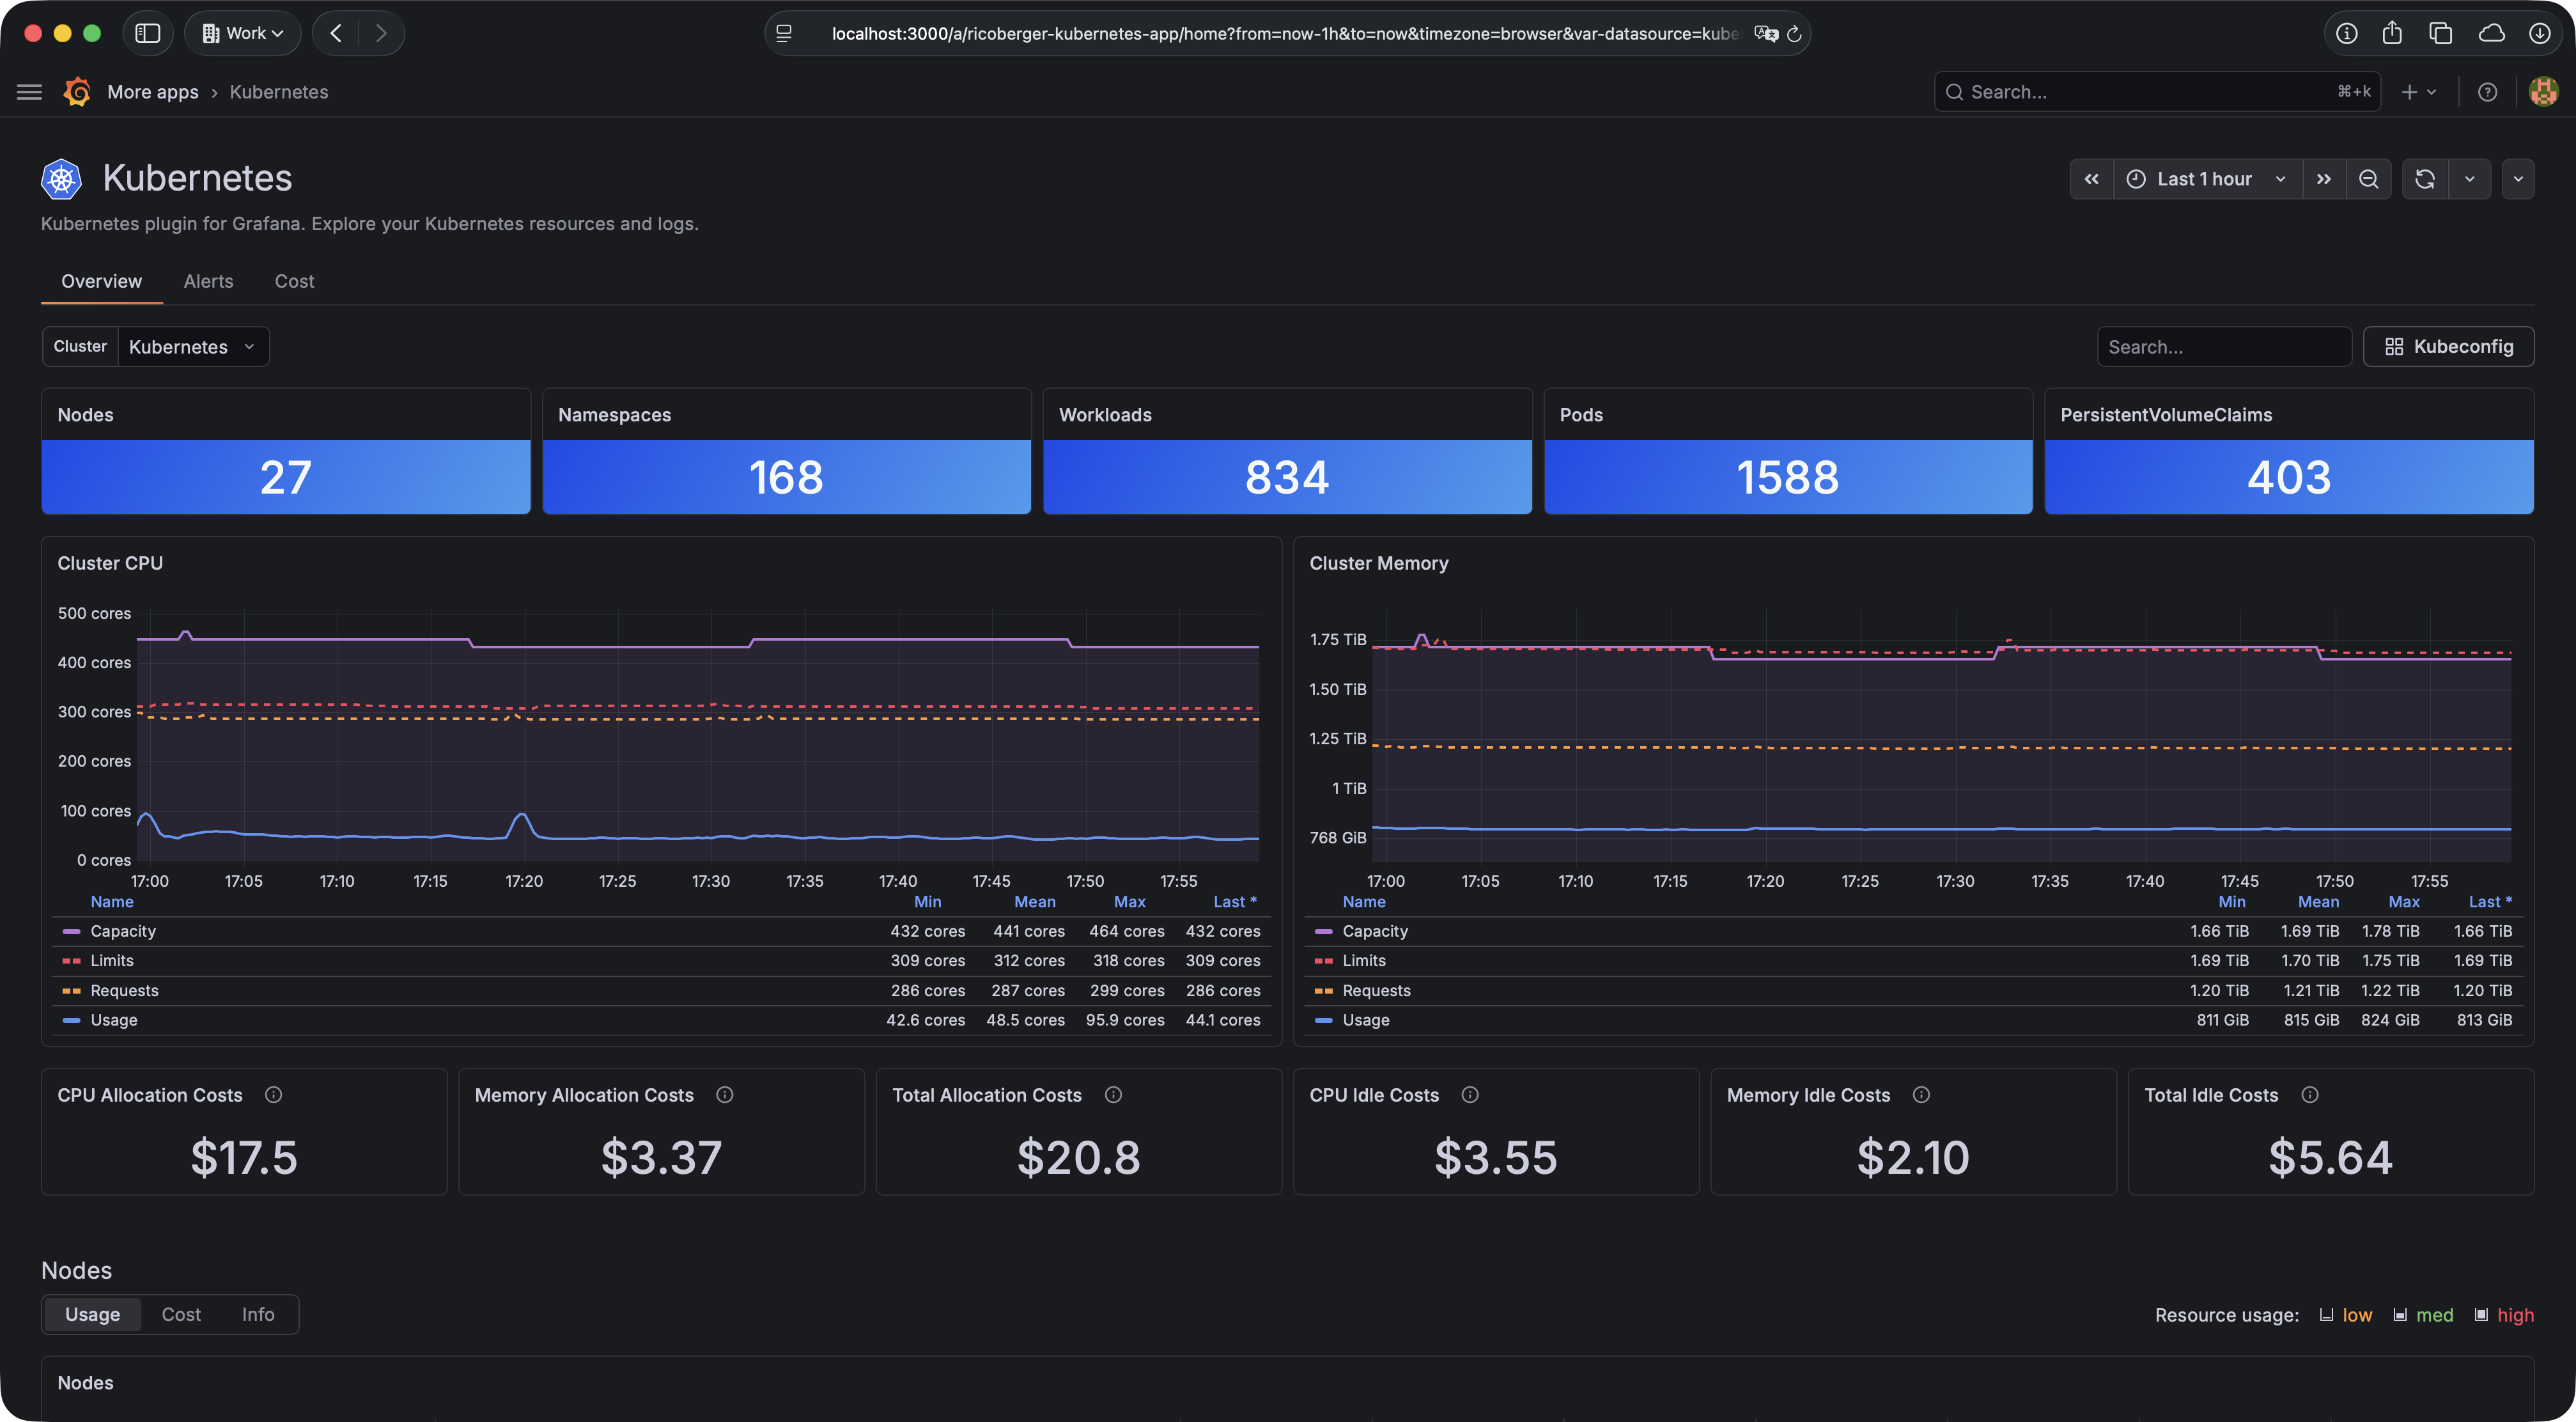
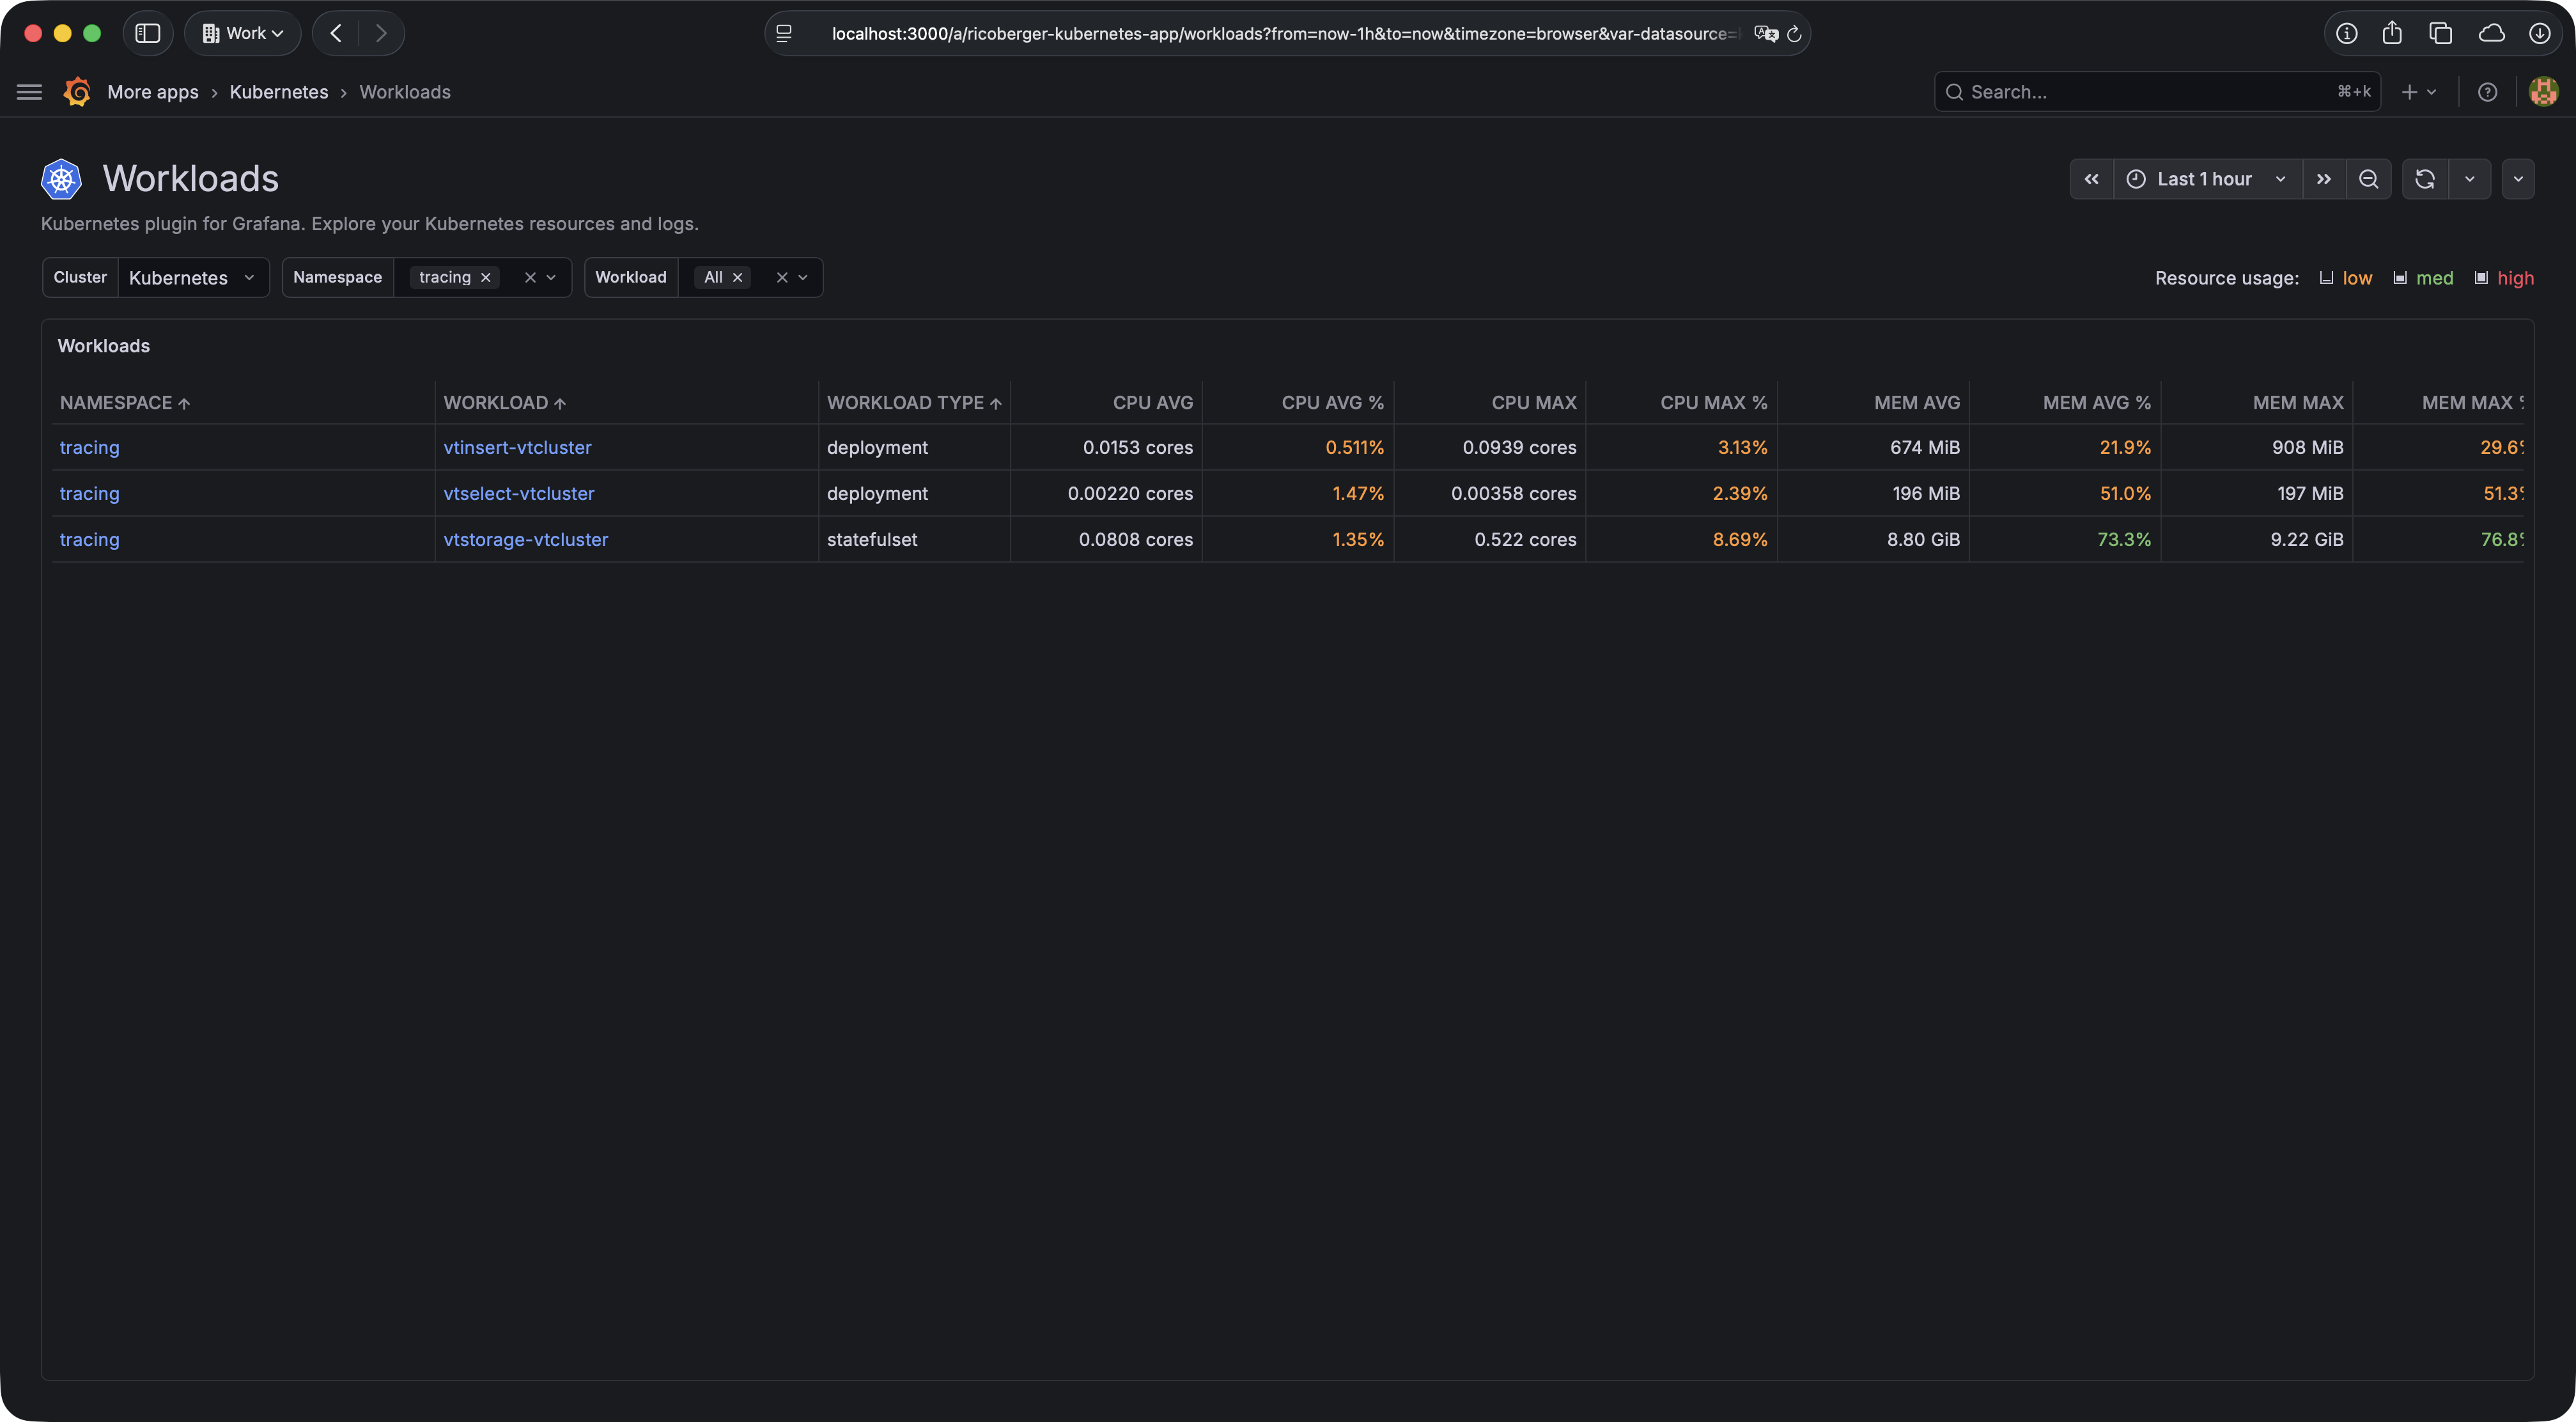 |
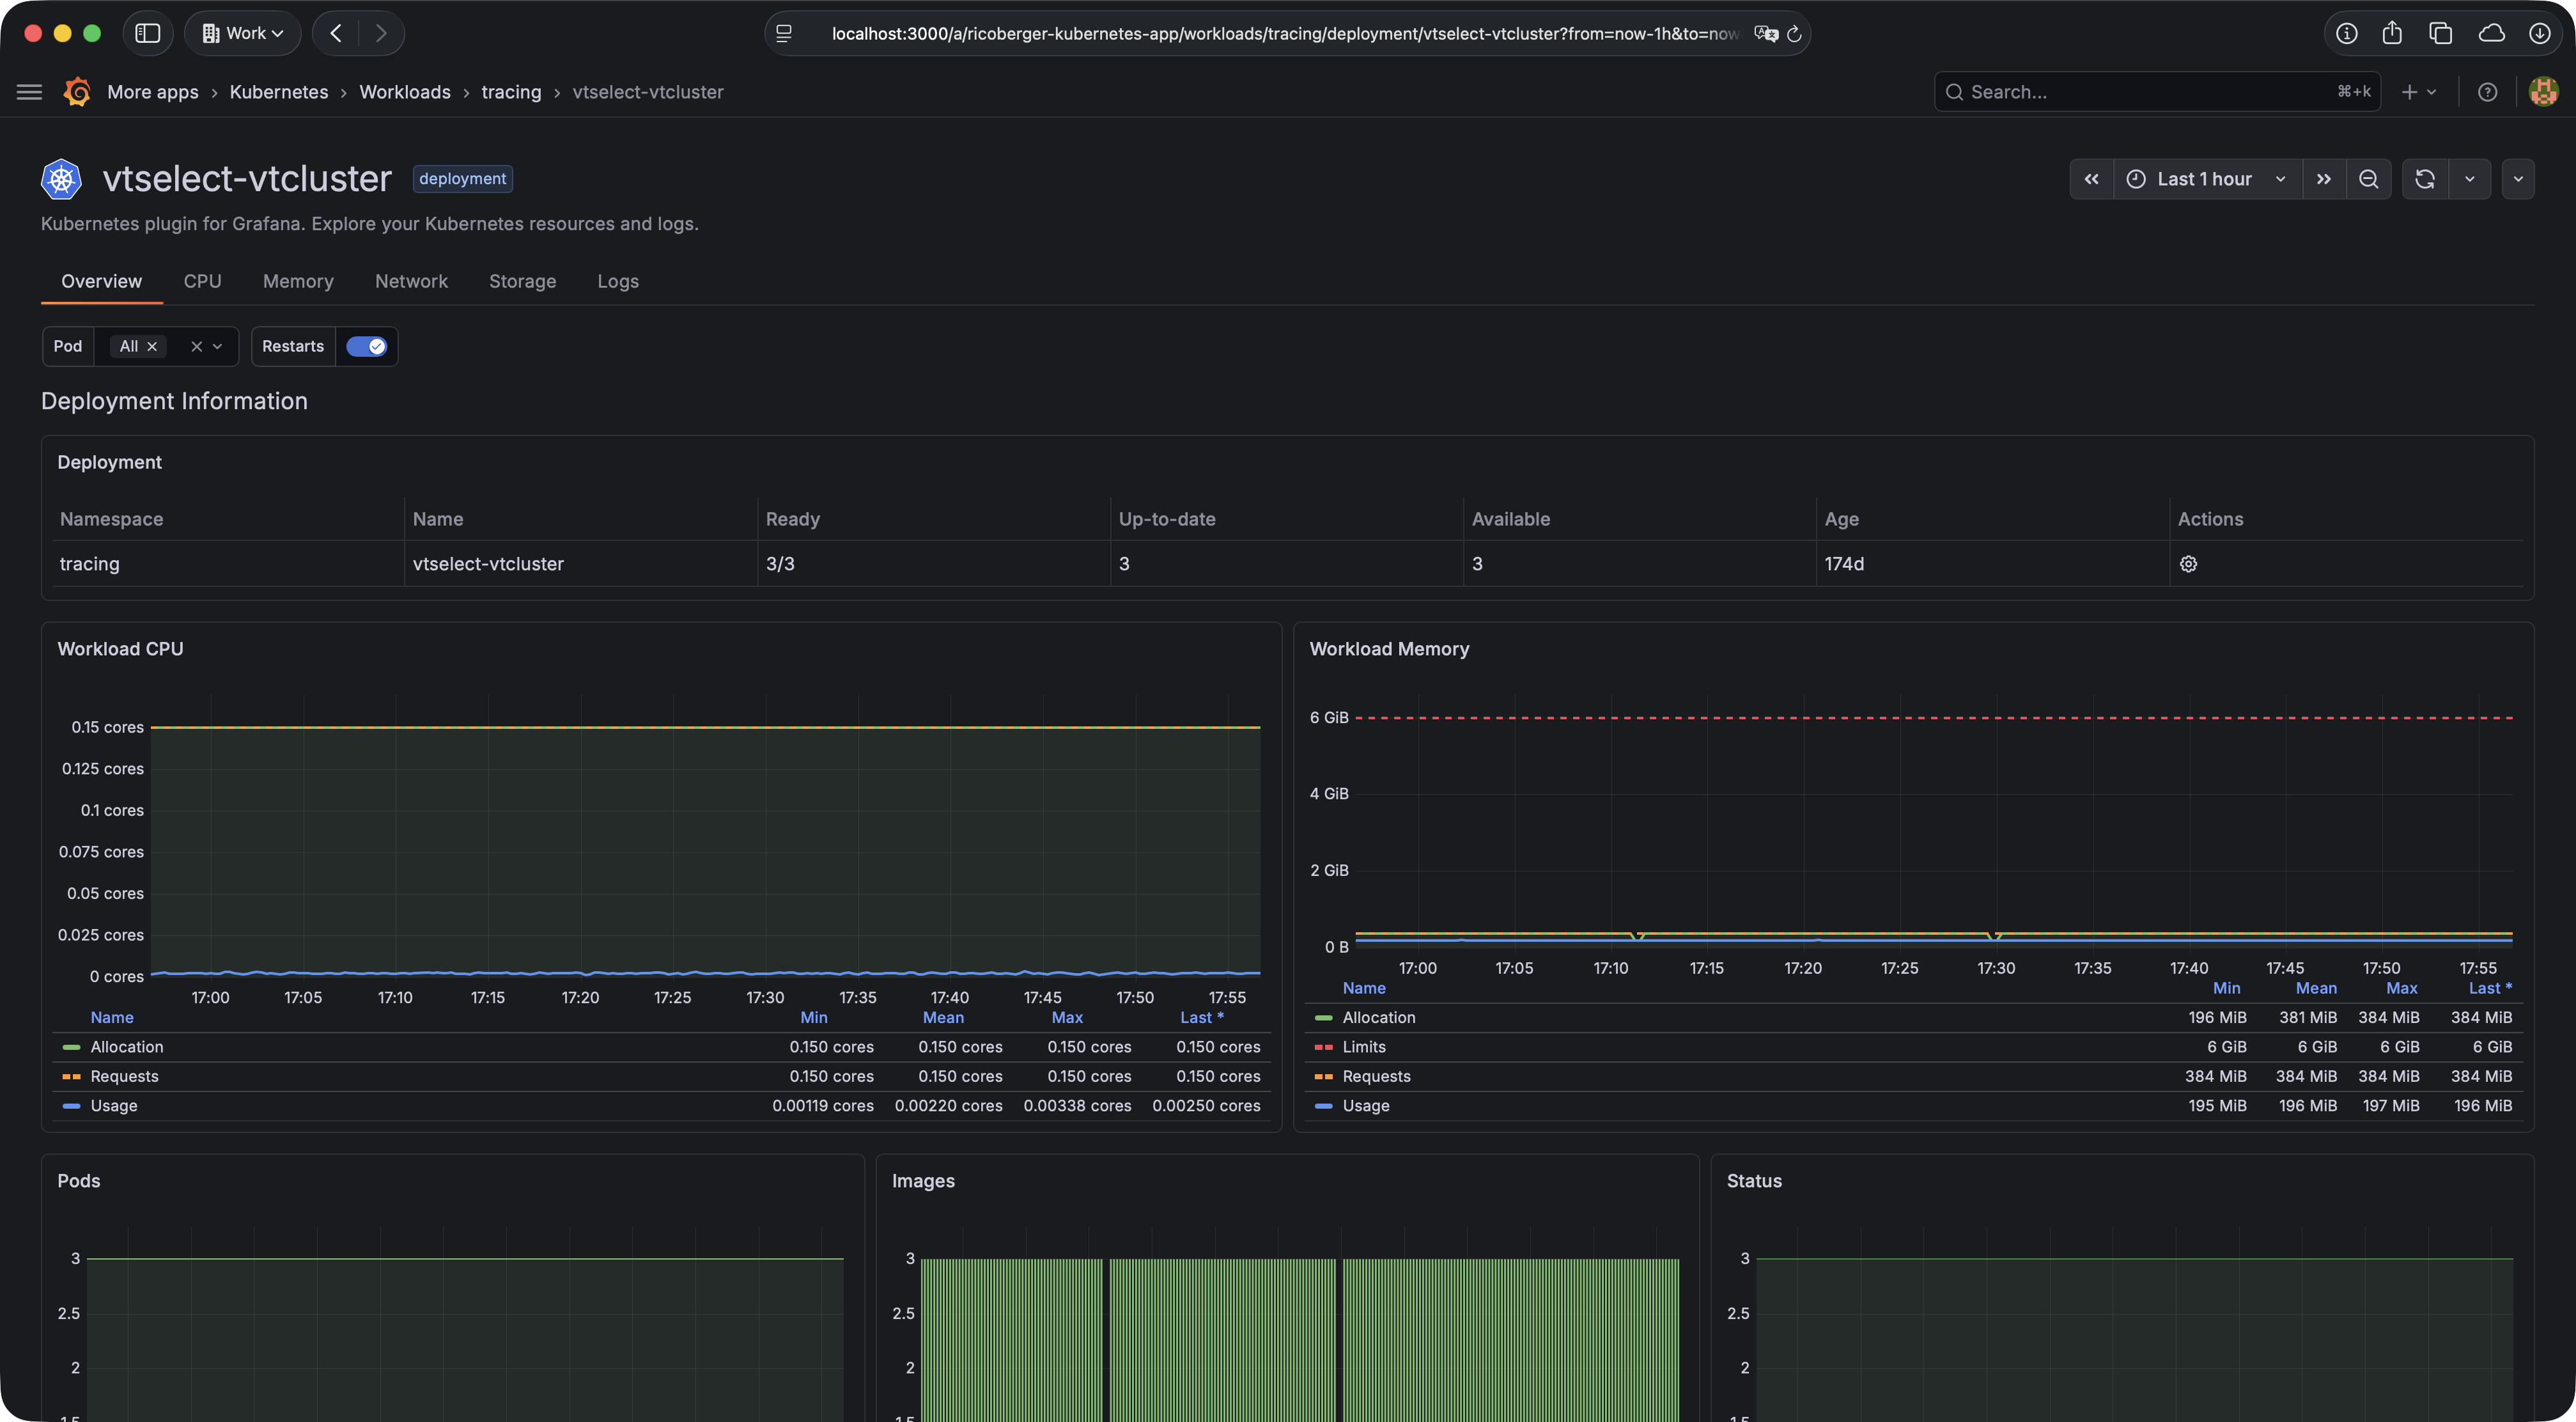 |
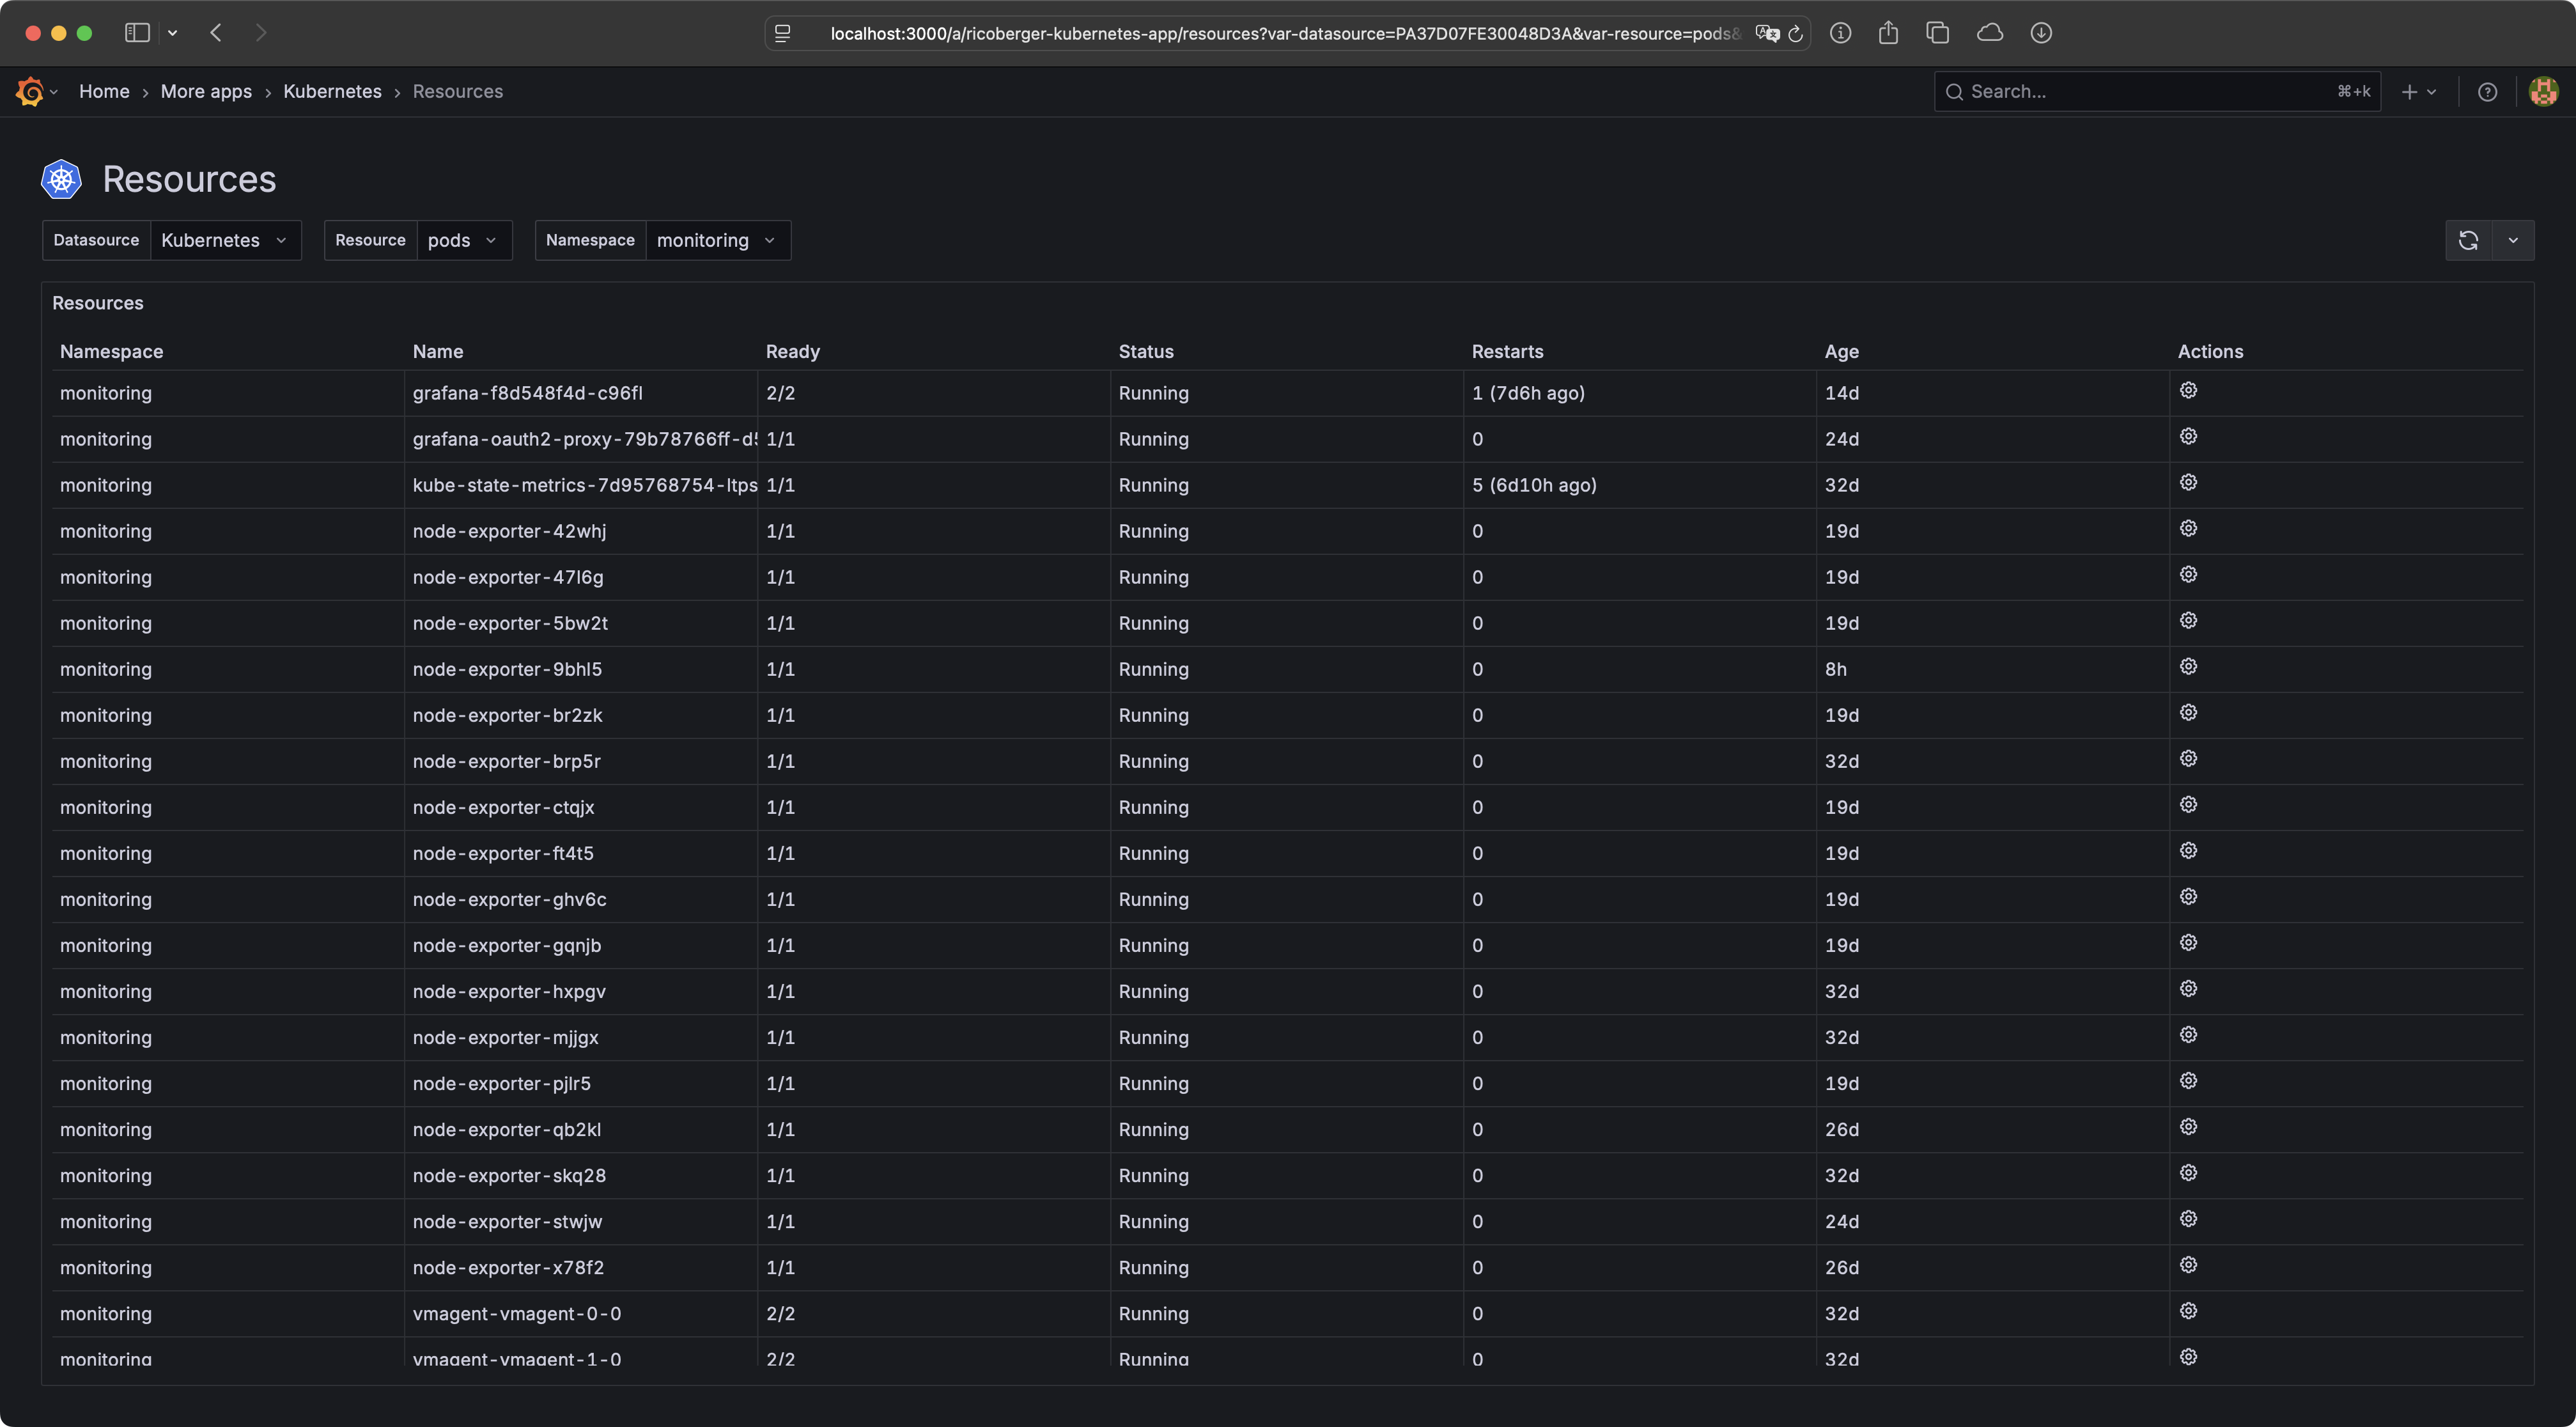 |
 |
 |
 |
Features
- View Kubernetes resources like Pods, DaemonSets, Deployments, StatefulSets, etc.
- Includes support for Custom Resource Definitions.
- Filter and search for resources, by Namespace, label selectors, field
selectors or JSONPath (for example the following JSONPath filter can be used
to get all Jobs for a CronJob with the name
mycronjob:{.items[?(@.metadata.ownerReferences[0].name=='mycronjob')]}). - Get a fast overview of the status of resources, including detailed information and events.
- Modify resources, by adjusting the YAML manifest files or using the built-in actions for scaling, restarting, creating or deleting resources.
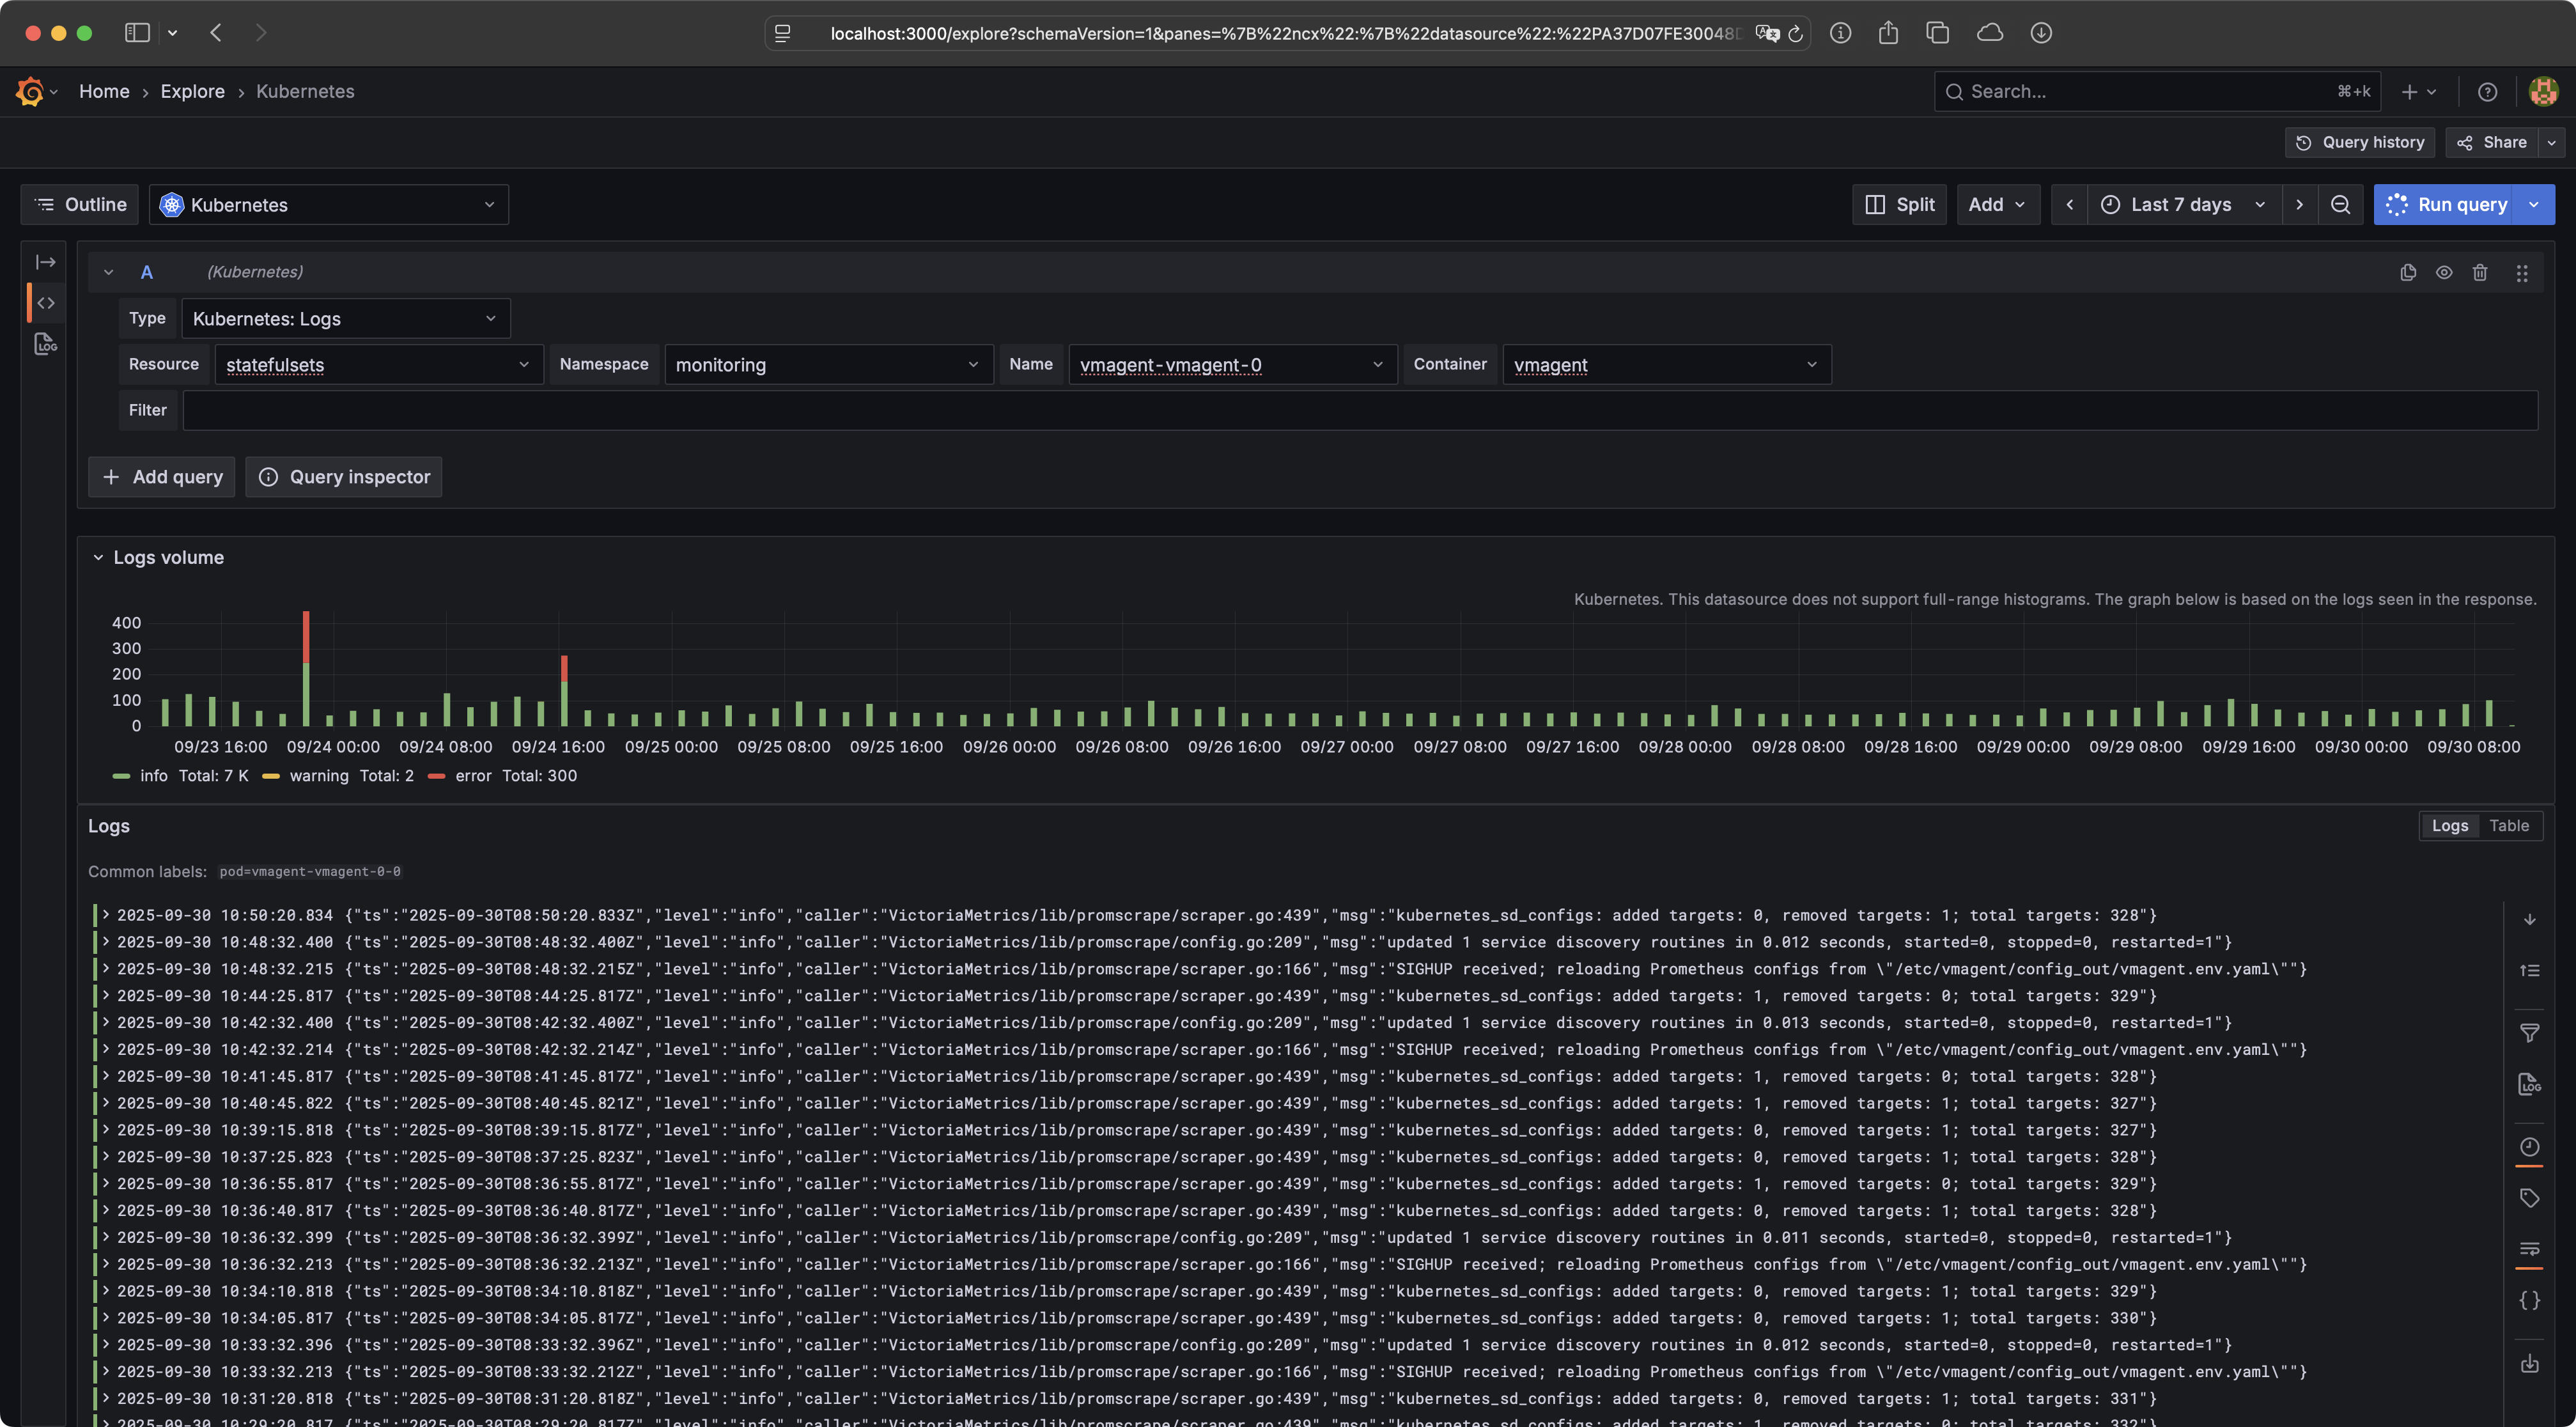
- View logs of Pods, DaemonSets, Deployments, StatefulSets and Jobs.
- Automatic JSON parsing of log lines and filtering of logs by time range and regular expressions.
- Role-based access control (RBAC), based on Grafana users and teams, to authorize all Kubernetes requests.
- Generate Kubeconfig files, so users can access the Kubernetes API using tools
like
kubectlfor exec and port-forward actions. - Integrations for metrics and traces:
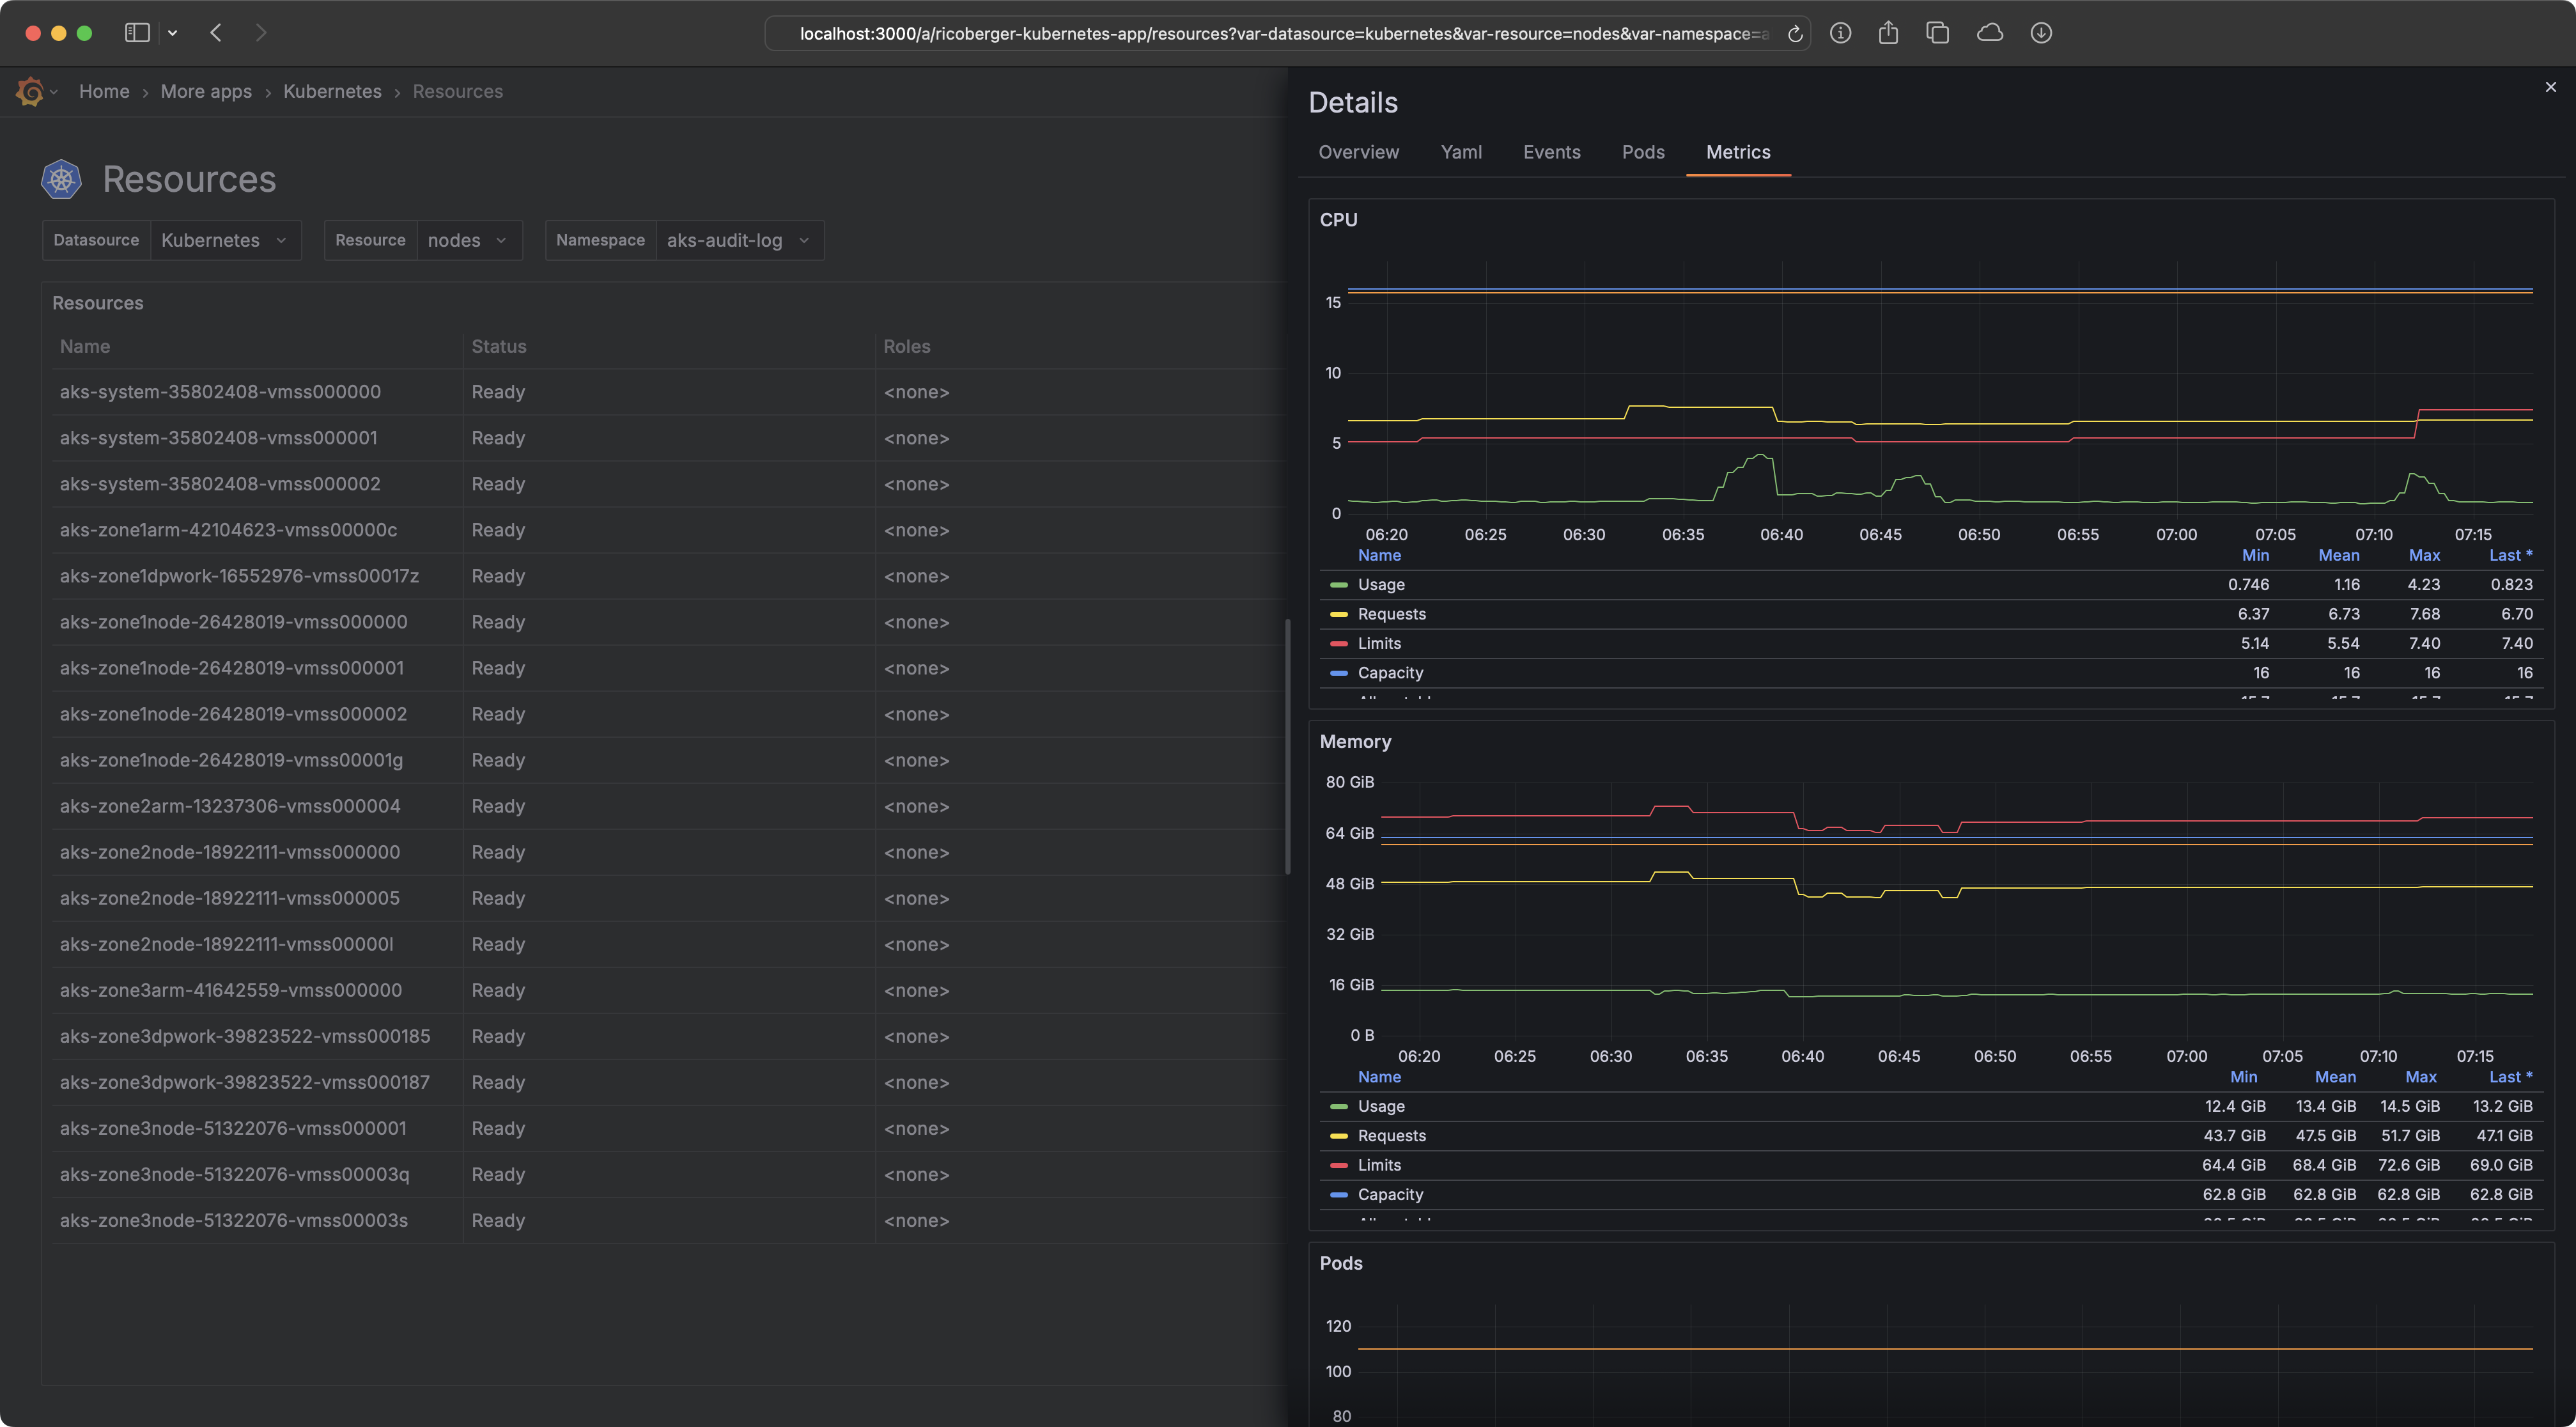
- Metrics: View metrics for Kubernetes resources like Pods, Nodes, Deployments, etc. using a Prometheus datasource.
- Logs: Instead of the built-in log viewer, you can also use another log datasource like VictoriaLogs to view the logs of Pods, DaemonSets, Deployments, StatefulSets and Jobs.
- Traces: Link traces from Pod logs to a tracing datasource like VictoriaTraces.
- Integrations for other cloud-native tools like Helm and Flux:
- Helm: View Helm releases including the history, rollback and uninstall Helm releases.
- Flux: View Flux resources, reconcile, suspend and resume Flux resources.
- cert-manager: View cert-manager resources, renew certificates and approve or deny certificate requests.
Installation
- Before you can install the plugin, you have to add
ricoberger-kubernetes-appandricoberger-kubernetes-datasourceto theallow_loading_unsigned_pluginsconfiguration option or to theGF_PLUGINS_ALLOW_LOADING_UNSIGNED_PLUGINSenvironment variable. - The plugin can then be installed by adding
ricoberger-kubernetes-app@<VERSION>@https://github.com/ricoberger/grafana-kubernetes-plugin/releases/download/v<VERSION>/ricoberger-kubernetes-app-<VERSION>.zipto thepreinstall_syncconfiguration option or theGF_PLUGINS_PREINSTALL_SYNCenvironment variable. - Once the plugin is installed, you have to activate the app in you Grafana
instance by navigating to Administration -> Plugins and data ->
Plugins -> Kubernetes and clicking on the Enable button
(
<GRAFANA-INSTANCE-URL>/plugins/ricoberger-kubernetes-app). - Last but not least, you have to add a new Kubernetes data source to your Grafana instance.
Configuration File
[plugins]
allow_loading_unsigned_plugins = ricoberger-kubernetes-app,ricoberger-kubernetes-datasource
preinstall_sync = ricoberger-kubernetes-app@0.2.0@https://github.com/ricoberger/grafana-kubernetes-plugin/releases/download/v0.2.0/ricoberger-kubernetes-app-0.2.0.zip
Environment Variables
export GF_PLUGINS_ALLOW_LOADING_UNSIGNED_PLUGINS=ricoberger-kubernetes-app,ricoberger-kubernetes-datasource
export GF_PLUGINS_PREINSTALL_SYNC=ricoberger-kubernetes-app@0.2.0@https://github.com/ricoberger/grafana-kubernetes-plugin/releases/download/v0.2.0/ricoberger-kubernetes-app-0.2.0.zip
Configuration
To add a new Kubernetes cluster to Grafana, create a new Kubernetes data source.
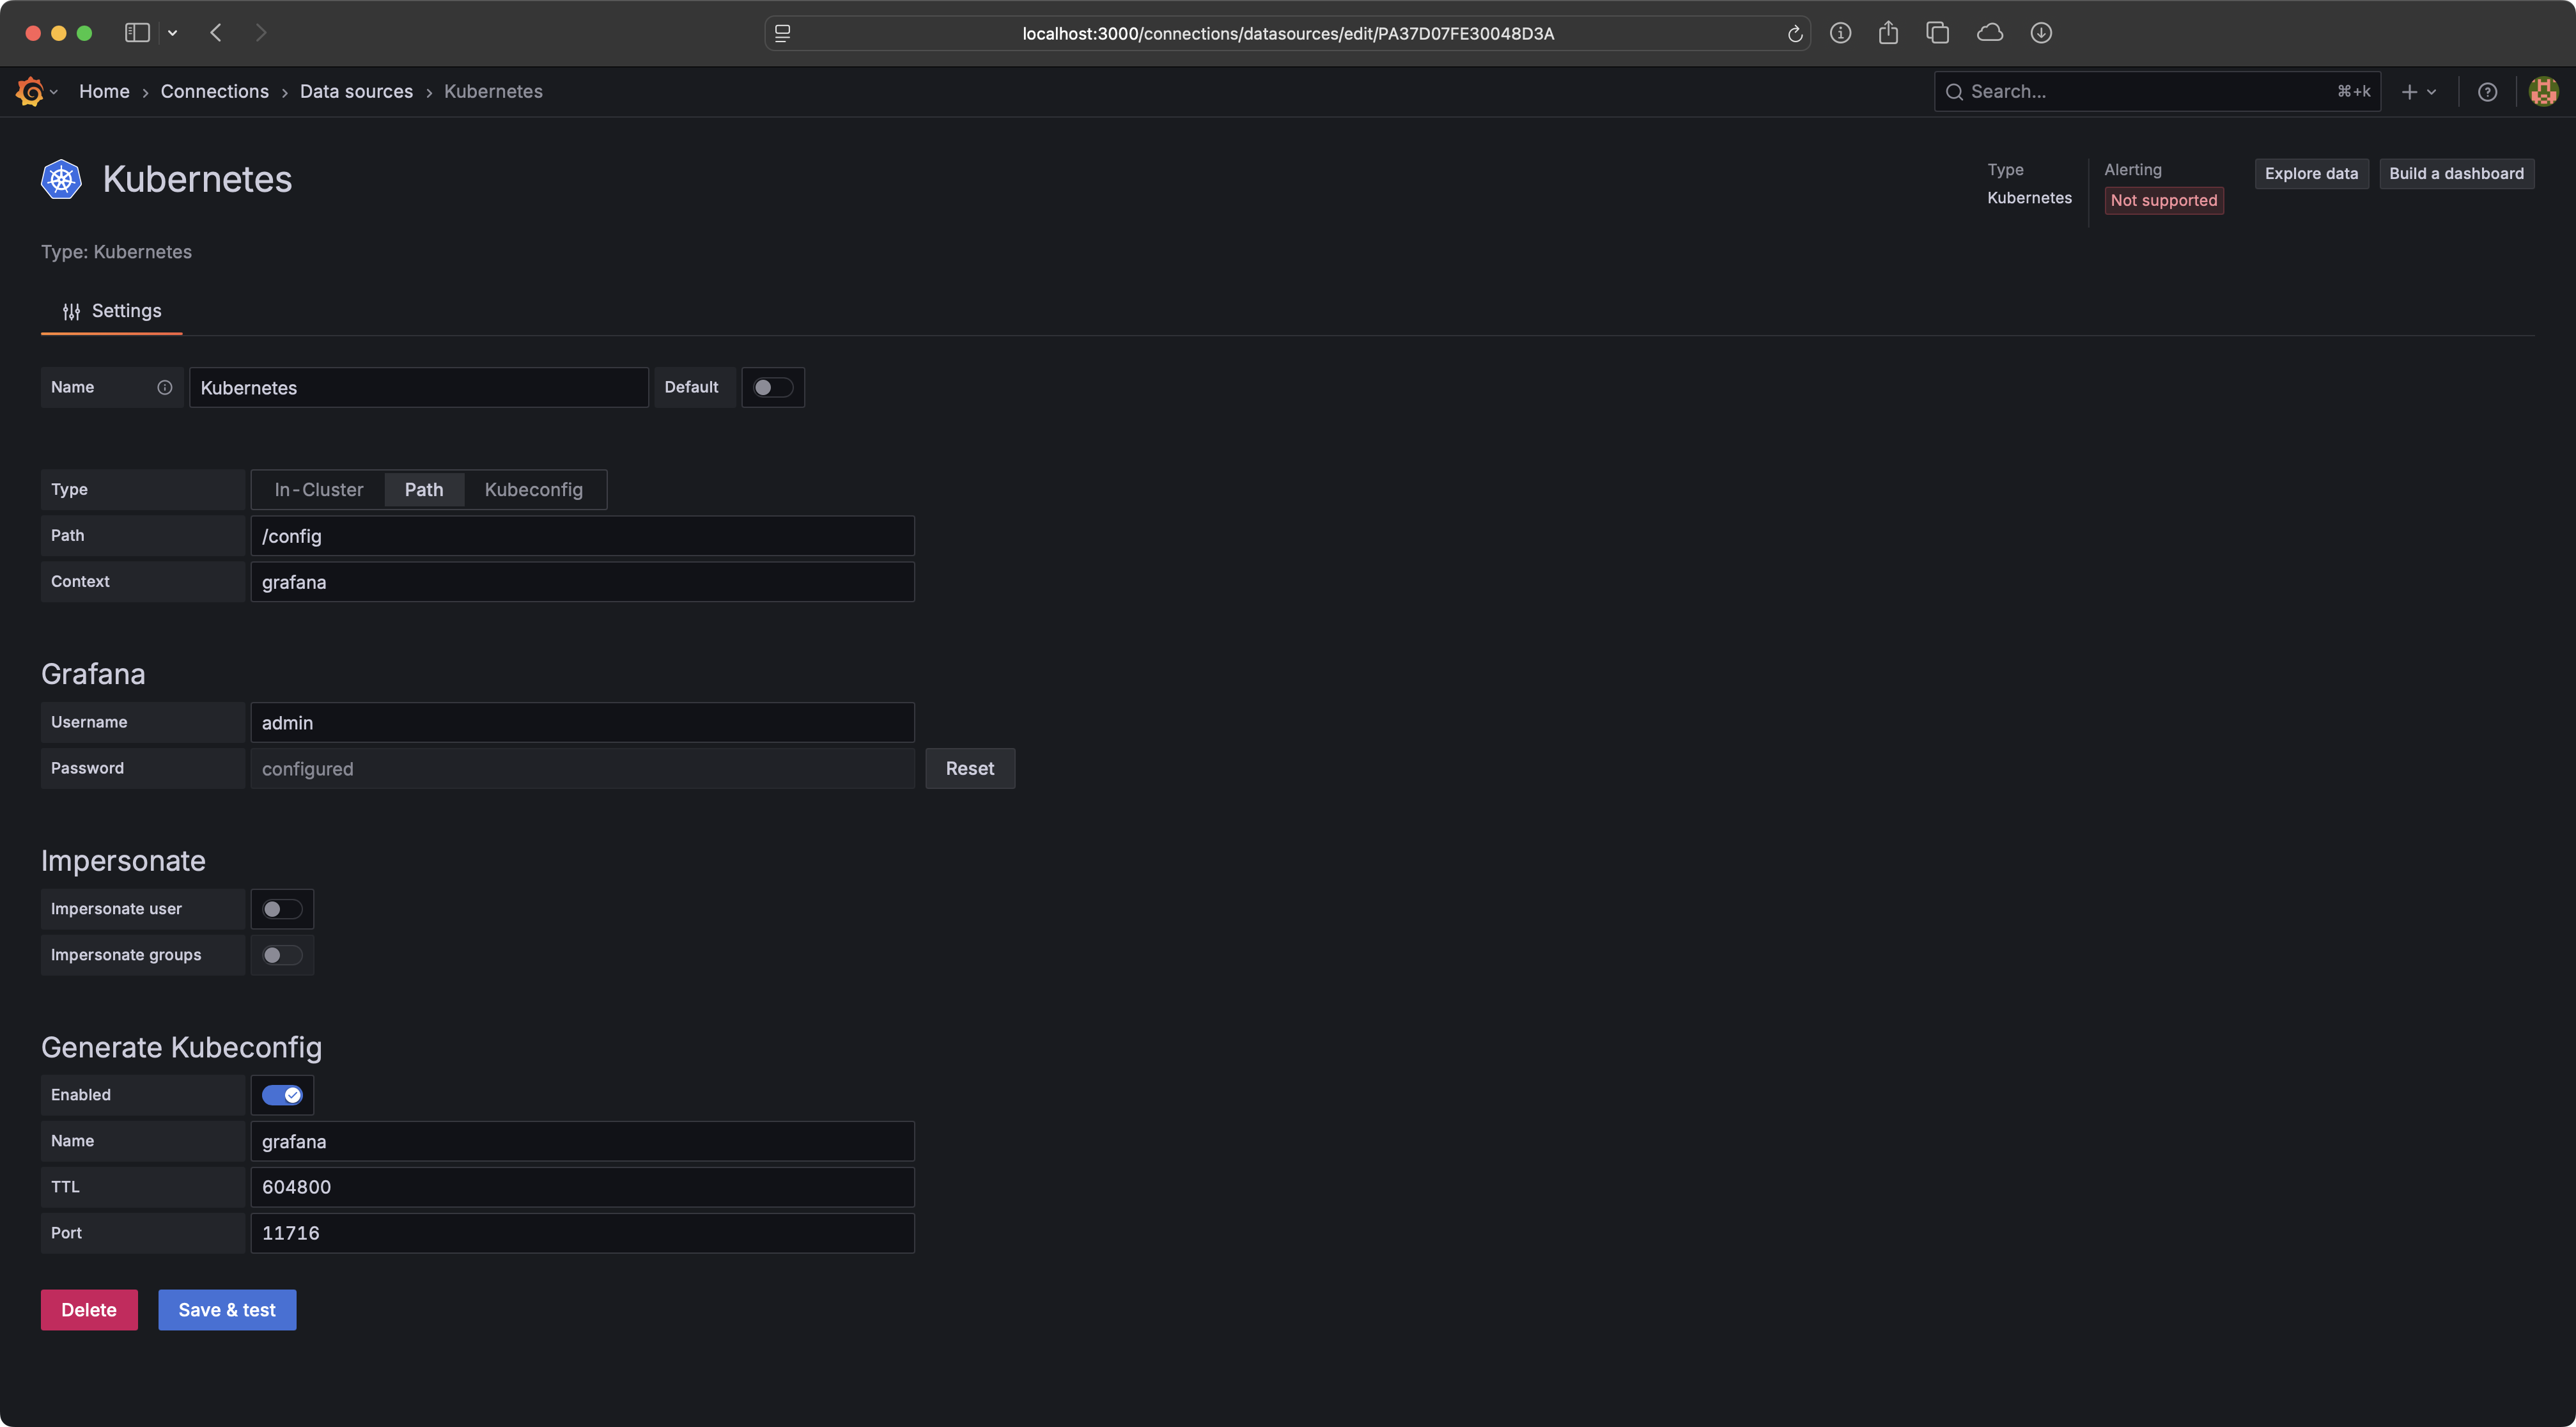
You can choose between multiple providers to add a Kubernetes cluster:
- In-Cluster: Use a ServiceAccount mounted to your Grafana Pods, to authenticate against the Kubernetes cluster.
- Path: Provide the path to a Kubeconfig file and the context, which should be used from this file.
- Kubeconfig: Upload a Kubeconfig file and store it within Grafana. The Kubeconfig file can only contain one context.
Grafana
To use the Impersonate and Generate Kubeconfig features of the plugin,
you have to enable basic authentication first, e.g. by setting the
GF_AUTH_BASIC_ENABLED environment variable to true or by enabling basic auth
in the
Grafana configuration.
Afterwards you have to provide a Grafana username and password for the plugin,
so that the plugin can interact with the Grafana API. The provided user should
have the Admin role.
You can also configure the role (Admin, Editor or Viewer) which is
assigned to the Grafana service accounts that are created for each user when the
Generate Kubeconfig feature is enabled. This role only affects the
permissions of the service account inside Grafana, it does not change the
Kubernetes permissions. The role defaults to Viewer.
Impersonate
The plugin can impersonate a Grafana user and the groups of the user when making requests against the Kubernetes API. This means that you can use role-based access control (RBAC) within the plugin.
If you have a user with the login admin you can create the following
ClusterRole and ClusterRoleBinding to allow this user to only list and get Pods
within the Kubernetes cluster:
kubectl create clusterrole grafana-admin-user --verb list,get --resource pods
kubectl create clusterrolebinding grafana-admin-user --clusterrole grafana-admin-user --user admin
If you have a team called admin you can create the following ClusterRole and
ClusterRoleBinding to allow all members of this team to only list and get Pods
within the Kubernetes cluster:
kubectl create clusterrole grafana-admin-team --verb list,get --resource pods
kubectl create clusterrolebinding grafana-admin-team --clusterrole grafana-admin-team --group admin
Generate Kubeconfig
The Grafana Kubernetes Plugin can also be used to generate a Kubeconfig for your
users, so that they can use kubectl for exec and port-forward actions, which
are not directly supported by the plugin.
If enabled the plugin will create a personal Grafana service account and service account token for all users. This token is then used in the Kubeconfig, so that the user gets access to Grafana, which will then forward the request to the Kubernetes API. This feature also uses the Impersonate feature if enabled.
To use this feature you have to provide a name for the Kubeconfig file which is generated, a time-to-live for the genated service account token in seconds and a port, which will be used to start the server responsible for authenticating the user and proxing the request to the Kubernetes API.
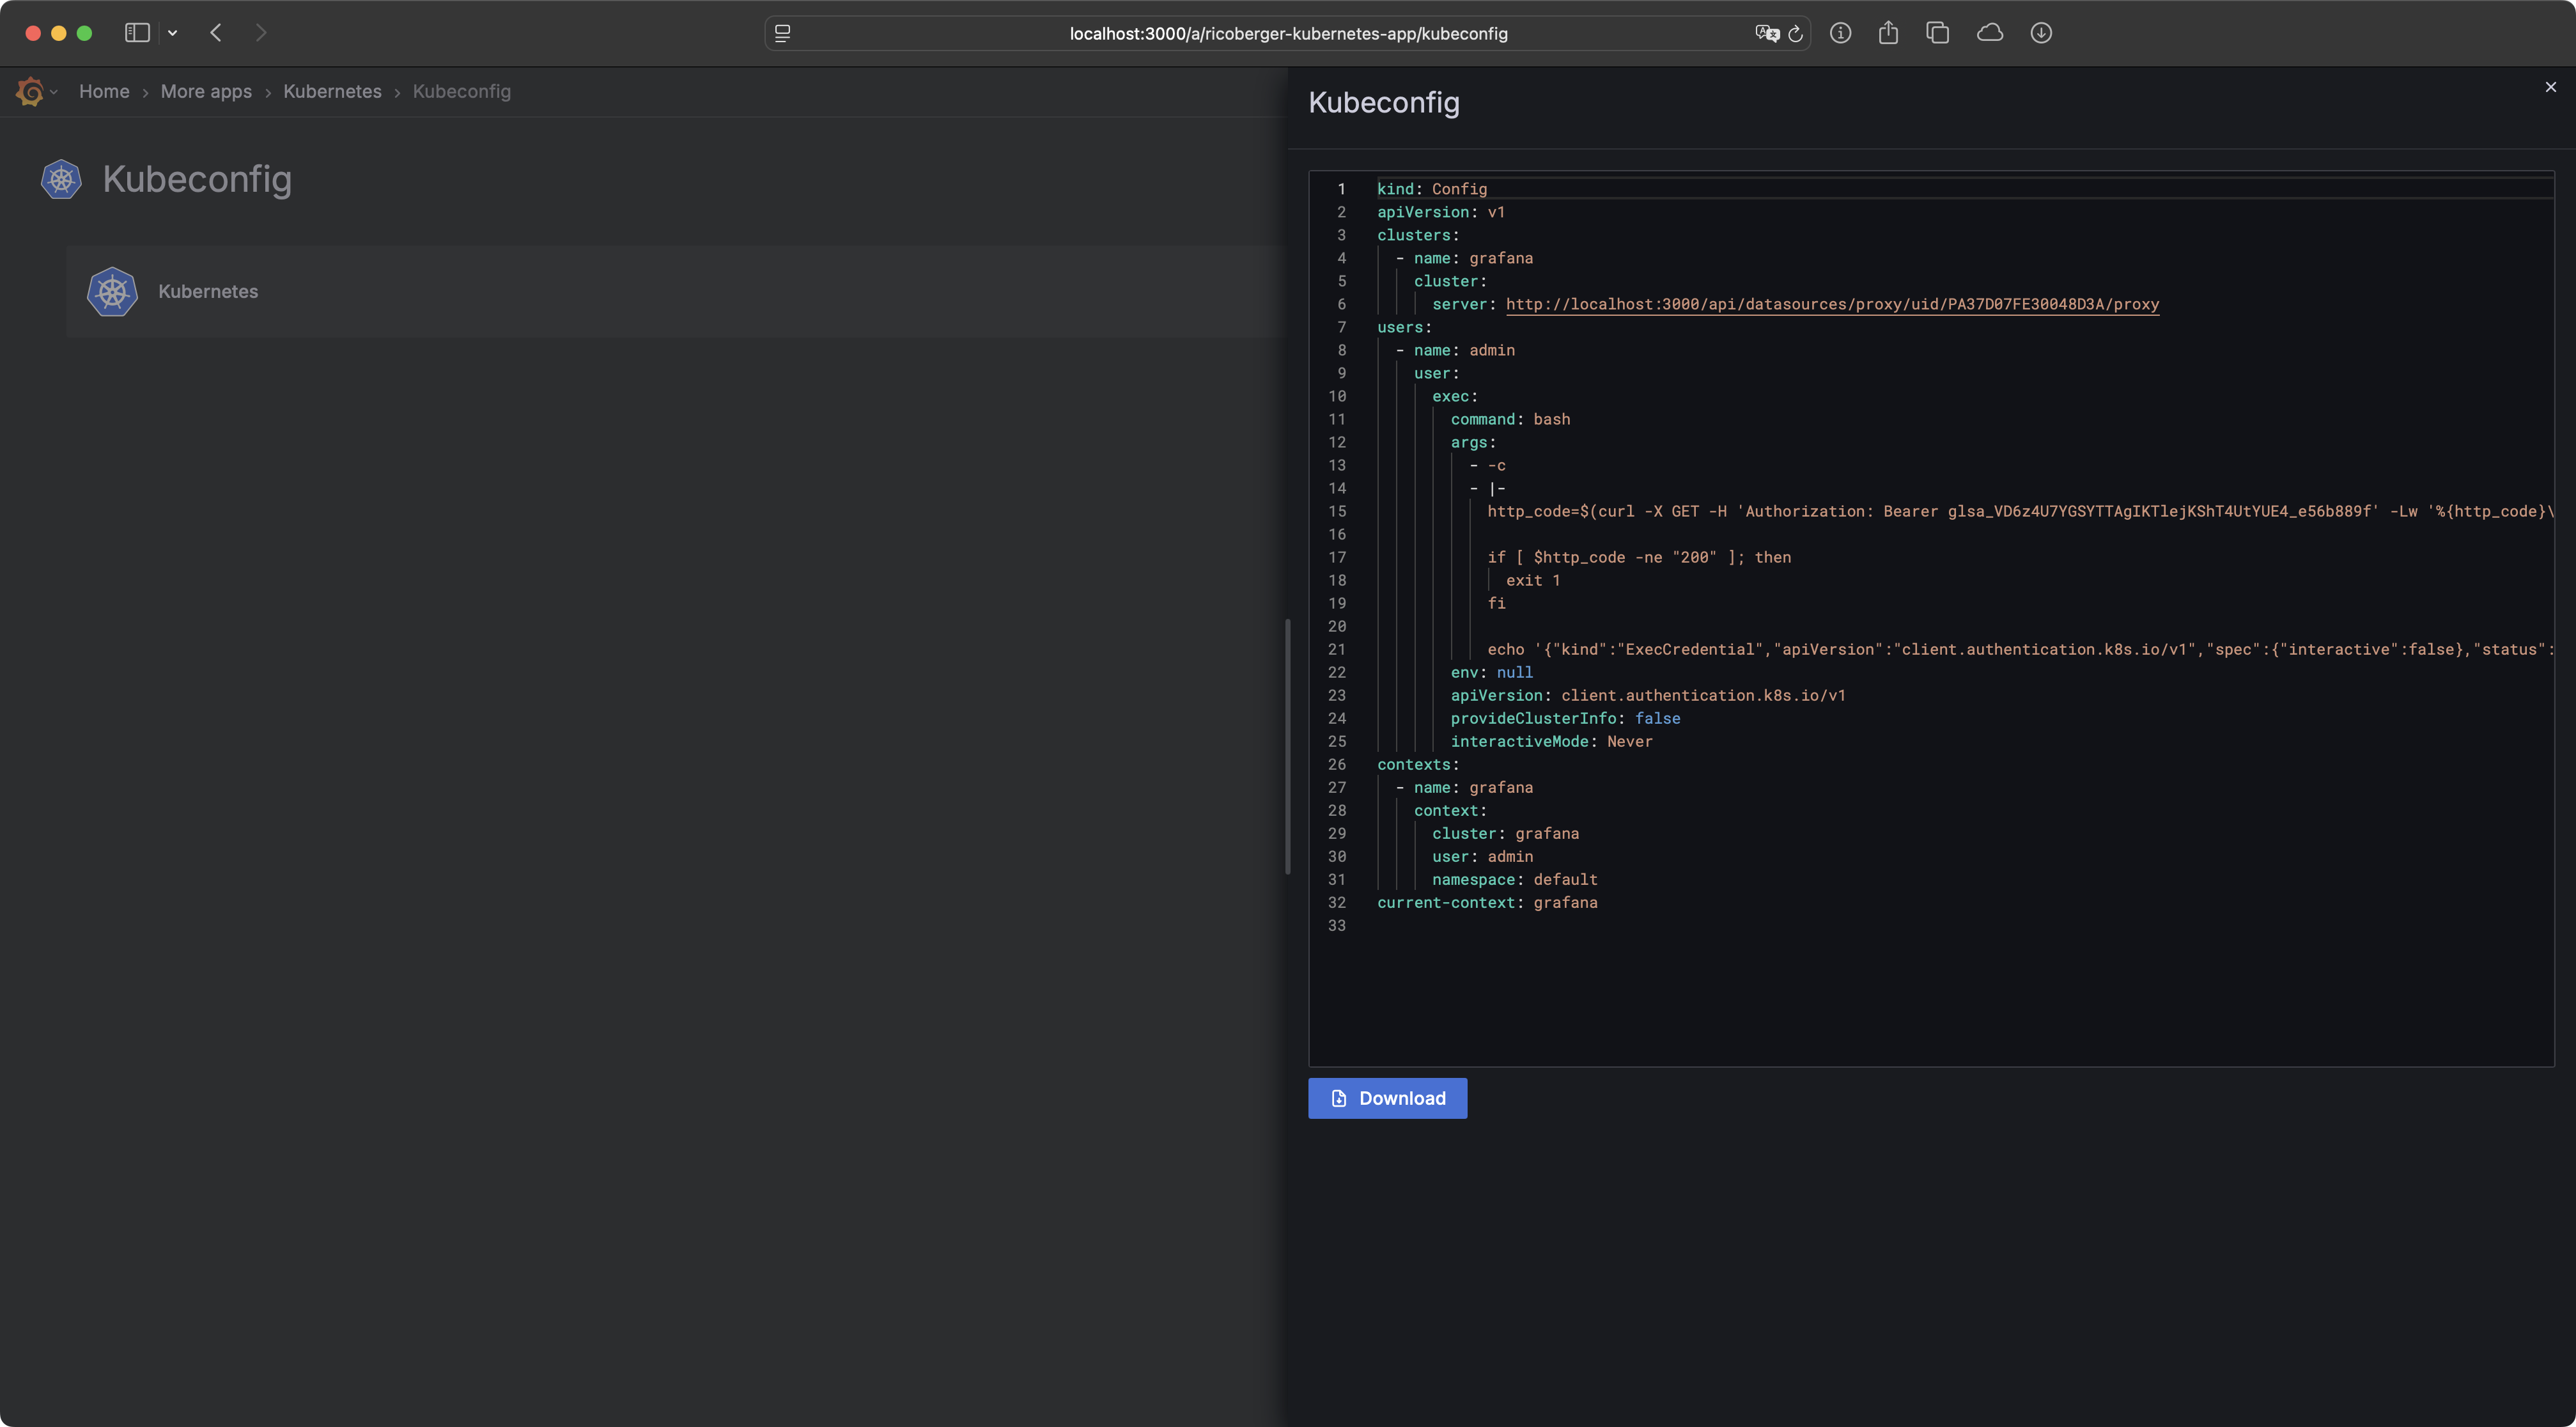
To make it easier to download the generated Kubeconfig file, the
kubectl-grafana kubectl plugin can be used. The plugin can be downloaded from
the
releases page
or by running the following command:
go install github.com/ricoberger/grafana-kubernetes-plugin/cmd/kubectl-grafana@latest
When the kubectl plugin is installed, the following command can be used to download the generated Kubeconfig. If the provided Kubeconfig file already contains a Kubeconfig it will be merged, with the downloaded Kubeconfig having a higher priority.
kubectl grafana kubeconfig --grafana-url <GRAFANA-INSTANCE-URL> --grafana-datasource <DATASOURCE-UID> --kubeconfig <PATH-TO-KUBECONFIG-FILE>
Integrations
Integrations allow you to integrate the Kubernetes datasource with other datasources to view metrics, logs or traces related to your Kubernetes resources.
Metrics
To view the metrics of your Kubernetes resources you have to provide the UID of a Prometheus datasource and the cluster label for the kubelet, kube-state-metrics and opencost metrics.
Logs
By default the built-in logs datasource is used in the Kubernetes dashboards.
You can also use another log datasource like VictoriaLogs to view the logs of
Pods, Workloads, Namespaces and Nodes. An example configuration for VictoriaLogs
is shown below. You can use the ${pod}, ${namespace} and ${node} variables
in the queries to filter the logs by the selected resource.
{
  "pod": {
    "datasource": {
      "type": "victoriametrics-logs-datasource",
      "uid": "victorialogs"
    },
    "queries": [
      {
        "refId": "A",
        "expr": "k8s.pod.name:=\"${pod}\" | sort by (_time) desc",
        "queryType": "instant",
        "maxLines": 1000
      }
    ]
  },
  "workload": {
    "datasource": {
      "type": "victoriametrics-logs-datasource",
      "uid": "victorialogs"
    },
    "queries": [
      {
        "refId": "A",
        "expr": "k8s.pod.name:in(${pod}) | sort by (_time) desc",
        "queryType": "instant",
        "maxLines": 1000
      }
    ]
  },
  "namespace": {
    "datasource": {
      "type": "victoriametrics-logs-datasource",
      "uid": "victorialogs"
    },
    "queries": [
      {
        "refId": "A",
        "expr": "k8s.namespace.name:=\"${namespace}\" | sort by (_time) desc",
        "queryType": "instant",
        "maxLines": 1000
      }
    ]
  },
  "node": {
    "datasource": {
      "type": "victoriametrics-logs-datasource",
      "uid": "victorialogs"
    },
    "queries": [
      {
        "refId": "A",
        "expr": "k8s.node.name:=\"${node}\" | sort by (_time) desc",
        "queryType": "instant",
        "maxLines": 1000
      }
    ]
  }
}
Traces
To connect traces to the logs of your Kubernetes resources in the built-in logs
viewer, you have to provide a traces query, which contains the datasource and
the query for your traces. In the query you can use the ${__value.raw}
variable which will be replaced with the actual trace id. For example, the
following query can be used to link to a Jaeger datasource:
{"datasource":"jaeger","queries":[{"query":"${__value.raw}","refId":"A"}]}.
Contributing
If you want to contribute to the project, please read through the contribution guideline. Please also follow our code of conduct in all your interactions with the project.
 Directories

Directories

| Path | Synopsis |
|---|---|
|
cmd
|
|
|
kubectl-grafana
command
|
|
|
grafana
Package grafana is a generated GoMock package.
|
Package grafana is a generated GoMock package. |
|
helm
Package helm is a generated GoMock package.
|
Package helm is a generated GoMock package. |
|
kubernetes
Package kubernetes is a generated GoMock package.
|
Package kubernetes is a generated GoMock package. |