xk6-top
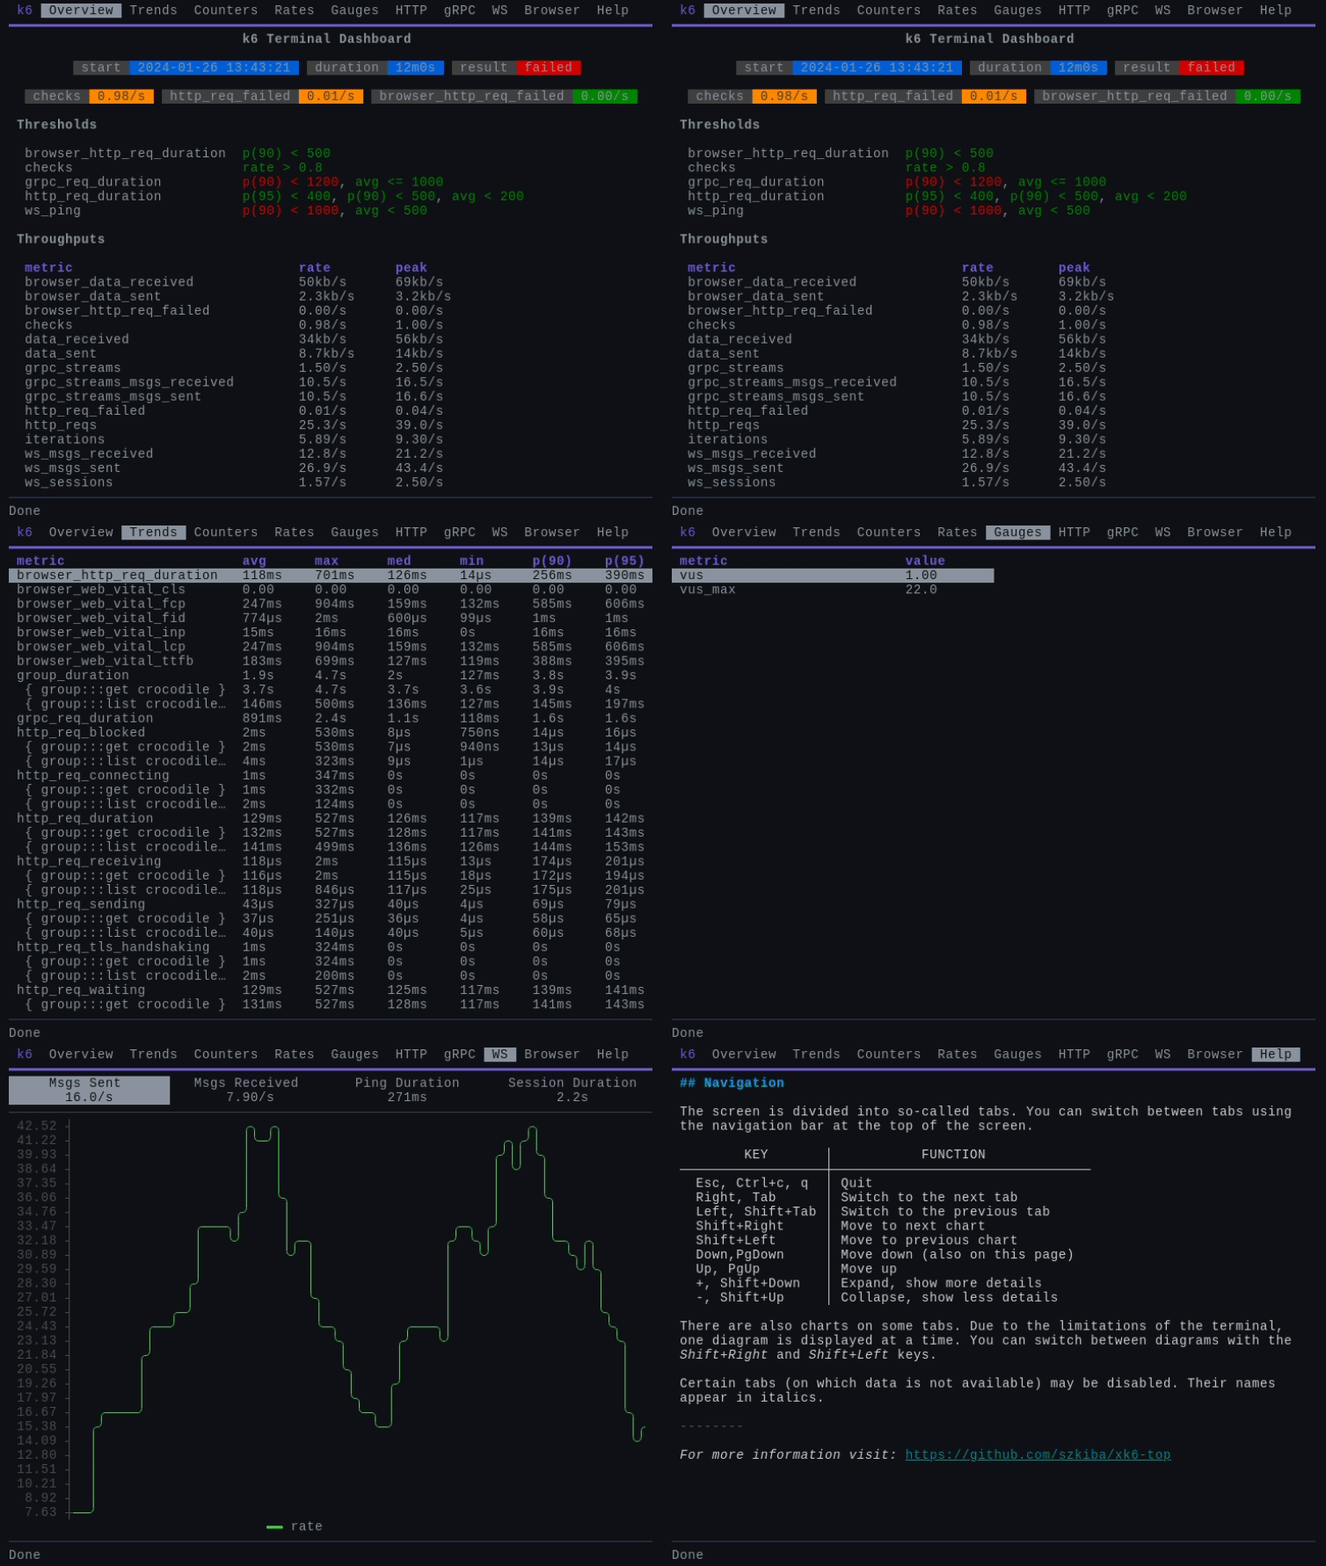
A k6 extension that that makes k6 metrics available on a terminal-based dashboard. The dashboard is updated continuously during the test run. In addition to the detailed results of the thresholds evaluations, the dashboard contains all metric aggregates in tabular form as well as graphs(!) of the most important metrics.
Also available as a standalone terminal-based metrics dashboard viewer (k6top and k6top run)

Features
- Quick overview of the k6 test run in the same terminal
- Displays the current status of the thresholds
- Displays tables of metrics
- Displays charts of relevant metrics
- The values of the metrics are updated dynamically
- It is easy to use even on a remote computer
Roadmap
The time allocated for the development of xk6-top depends on your feedback. If you like xk6-top, star the repository and give feedback in the discussions. The following new features are planned:
- New Info tab for displaying test metadata (e.g. script name, script options)
- Support for scenarios
Prerequisites
xk6-top (and k6top) utilizes the SSE stream of the k6 web-dashboard to display the aggregated metric values. The web-dashboard is a built-in fature in k6 starting from v0.49.0. For previous k6 versions, the xk6-dashboard extension (and the --out web-dashboard flag) is also required to use xk6-top.
The aggregation period is 10s by default. The data on the dashboard is updated at the end of each period. This period can be modified by configuring the k6 web-dashboard.
Download
You can download pre-built k6 binaries from the Releases page. Check the Packages page for pre-built k6 Docker images.
Build
Go version 1.21 is required as a minimum for the build.
The xk6 build tool can be used to build a k6 that will include xk6-top extension:
$ xk6 build --with github.com/szkiba/xk6-top@latest
For more build options and how to use xk6, check out the xk6 documentation.
Usage
To use the terminal dashboard, you simply need to specify the top output flag in the k6 run command
$ ./k6 run --out top script.js
In the help menu, you can find useful information (eg navigation).
Navigation
The screen is divided into so-called tabs. You can switch between tabs using the navigation bar at the top of the screen.
| Key |
Function |
Esc, Ctrl+c, q |
Quit |
Right, Tab |
Switch to the next tab |
Left, Shift+Tab |
Switch to the previous tab |
Shift+Right |
Move to next chart |
Shift+Left |
Move to previous chart |
Down,PgDown |
Move down |
Up, PgUp |
Move up |
+, Shift+Down |
Expand, show more details |
-, Shift+Up |
Collapse, show less details |
There are also charts on some tabs. Due to the limitations of the terminal, one chart is displayed at a time. You can switch between charts with the Shift+Right and Shift+Left keys.
Certain tabs (on which data is not available) may be disabled. Their names appear in italics.
Overview tab
The Overview tab provides an overview of the test run. Here you can find the most important parameters such as start time, elapsed time, remaining time (in the case of a running test) and the colored result of the test run (in the case of a completed test).
The most important element of the Overview tab is the table containing the current state of the thresholds in detail. The individual threshold expressions are marked with green (passed) or red (failed) color according to the success of the evaluation. From this table, you can immediately see which threshold expression failed.
Metrics tables
The aggregated metric values are available in tabular form on the tabs named according to the type of metric (Trends, Counters, Rates, Gauges).
By default, the table contains the tags expanded. Rows containing tags can be collapsed with the - key or the Shift+Up key combination. They can be expanded at any time later with the + key or the Shift+Down key combination.
Metrics charts
The most important metrics are also available in the form of a time chart on the tabs with names corresponding to the protocol (HTTP, gRPC, WS, Browser).
Due to the limitations of the terminal, one chart can be seen on these tabs at a time. A second-level navigation enables the choice of a chart within a tab. You can switch to the next/previous chart with the key combinations Shift+Right and Shift+Left.
The chart displaying the trend type metric contains the percentile values in addition to the average value. Percetile series can be hidden individually by repeatedly using the - key or the Shift+Up key combination. They can be displayed at any type later with repeatedly using the + key or the Shift+Down key combination.
Command Line
The CLI tool called k6top allows you to connect and display the dashboard for k6 processes (even running on a remote machine).
Development
How It Works
The terminal-based dashboard uses the same SSE stream as a data source as the web dashboard. To be precise, the SSE stream is generated by the k6 extension part of the web dashboard and used by the web dashboard UI part and the terminal dashboard UI. In this sense, the terminal-based dashboard can also be considered the client of the web dashboard running in the terminal.
One of the most convenient features is the parsing and continuous evaluation of threshold expressions based on current metrics. The evaluation is done using a simple expression evaluation library and is compatible with the k6 threshold expression evaluator.
The user interface was created using the bubbletea framework. The operation of bubbletea is message-based, so it can be well matched to the event-based dashboard data stream. Dashboard events become bubbletea messages and the screen is updated based on these messages.
Tasks
This section contains a description of the tasks performed during development. If you have the xc (Markdown defined task runner) command-line tool, individual tasks can be executed simply by using the xc task-name command.
Click to expand
lint
Run the static analyzer.
golangci-lint run
test
Run the tests.
go test -count 1 -race -coverprofile=build/coverage.txt ./...
coverage
View the test coverage report.
go tool cover -html=build/coverage.txt
build
Build the executable binary.
This is the easiest way to create an executable binary (although the release process uses the goreleaser tool to create release versions).
go build -ldflags="-w -s" -o build/k6top ./cmd/k6top
xk6 build latest --with github.com/szkiba/xk6-top=.
snapshot
Creating an executable binary with a snapshot version.
The goreleaser command-line tool is used during the release process. During development, it is advisable to create binaries with the same tool from time to time.
goreleaser build --snapshot --clean --single-target -o build/k6top
doc
Updating the documentation.
Some parts of the documentation, such as the CLI Reference, example codes, are automatically generated.
go generate ./internal/cmd
marp -o docs/intro/index.html docs/intro.md
social
Updating GitHub social image.
exiftool -ext png -overwrite_original -XMP:Subject+="k6 terminal based dashboard" -Title="Terminal based metrics dashboard for k6" -Description="Terminal based metrics dashboard for k6" -Author="Ivan SZKIBA" .github
clean
Delete the build directory.
rm -rf build
all
Run all tasks.
Requires: lint,test,doc,build,snapshot
k6top
Terminal based metrics dashboard viewer for k6
Synopsis
Display k6 metrics on a terminal-based dashboard
k6top connects to a k6 process (even a remote one) and displays metrics on a terminal-based dashboard.
It utilizes the SSE stream of the k6 web dashboard to display the aggregated metric values. The aggregation period is 10s by default. The data on the dashboard is updated at the end of each period. This period can be modified by configuring the k6 web dashboard.
The address of the k6 web dashboard can be specified with the --url flag. Thus, the metrics of local k6 running on a non-default port or even k6 running on a remote computer can be displayed.
k6top [flags]
Flags
  -h, --help         help for k6top
  -u, --url string   k6 web dashboard URL (default "http://127.0.0.1:5665")
SEE ALSO
- k6top run - k6 test runner and terminal-based metrics dashboard viewer
k6top run
k6 test runner and terminal-based metrics dashboard viewer
Synopsis
Run k6 test and display metrics on terminal-based dashboard
The k6top run command starts the k6 run command with the specified arguments and then displays the metrics dashboard in the terminal. A k6 with at least version v0.49.0 must be in the command search path.
In the launched k6, the web dashboard feature will be enabled. This is necessary because the SSE stream of the web dashboard is also used by the terminal-based dashboard as a data source.
If the environment variables K6_WEB_DASHBOARD_HOST and K6_WEB_DASHBOARD_PORT are set, their values are taken into account by the command.
The k6top run command has no flags, all arguments are passed to the k6 run command without interpretation or changes.
k6top run [flags]
Flags
-h, --help help for run
SEE ALSO
- k6top - Terminal based metrics dashboard viewer for k6
 Documentation
 Directories
