

 README

Tracepanel for Go


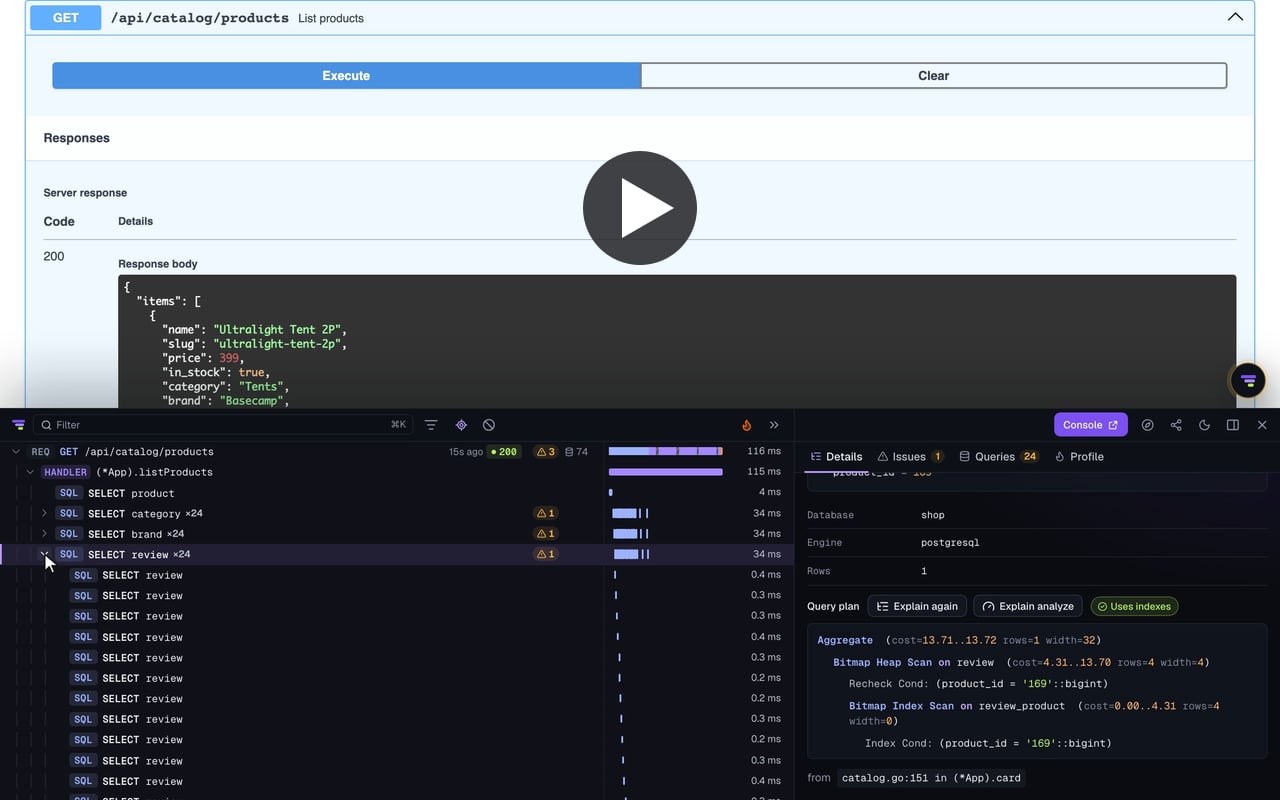
See what your Go app is really doing. Tracepanel records each request of your app with its SQL queries, Redis commands, outgoing HTTP and gRPC calls, Kafka messages, logs and panics. It points out N+1 queries, duplicates, slow SQL and long transactions, and names the line of code to fix. You read it in a panel on your pages and in a console.
It runs while you develop, and everything stays on your machine.
Works with
| Supported | |
|---|---|
| Go | 1.26 and later, on Linux, macOS and Windows. |
| Routers | net/http's ServeMux, gin, Echo v4 and v5, and any router on net/http (chi, gorilla) with one setting. Fiber isn't supported yet. |
| Databases | Any database on database/sql (your own queries, sqlx, sqlc, GORM, Bun), pgx and GORM. Transactions. EXPLAIN of a query on the database it came from. |
| Redis | go-redis v9, with its own N+1 and duplicates. |
| Messaging | kafka-go: what a writer sends, and each message handled as a trace of its own, linked to the one that sent it. |
| HTTP and gRPC | Calls made with the request's context, each with a traceparent. gRPC calls served and made. |
| Background work | Goroutines started with tracepanel.Go as tasks, linked to the request; commands and jobs as traces of their own. |
| Logs | slog, zap and zerolog, each record on the request that made it, with its line. |
| Errors | Panics, with your frames and the source around them. |
| Profiling | Where a request's CPU time goes, as a flame graph, when you ask for it. |
| Browser | The badge and its panel on your app's HTML pages and its Swagger UI. |
The core module has no dependencies. Each library integration is a module of its own, so you get only those you use.
Install
go get github.com/tracepanel/tracepanel-go
Wrap the app's handler, and give sql.Open the driver's name through
tracepanel.Driver:
import tracepanel "github.com/tracepanel/tracepanel-go"

db, err := sql.Open(tracepanel.Driver("pgx"), dsn)
// ...
http.ListenAndServe(addr, tracepanel.WrapHandler(mux))
Run the app with go run .. The first request starts the agent, which keeps
the traces and serves the console: the badge on an HTML page opens it, and the
Tracepanel-Url header names it. The SDK downloads the agent the first time
and checks it against the checksums it was released with.
Pass the request's context down (db.QueryContext(r.Context(), ...)): a query,
a log record or a call joins the request's trace through it.
Development only
Tracepanel records under go run only. A binary built with go build records
nothing: WrapHandler, Driver and the rest hand back what they were given,
and no agent is downloaded or started. TRACEPANEL_ENABLED=1 records in any
build, and 0 never. To record a built binary:
go install github.com/tracepanel/tracepanel-go/cmd/tracepanel@v0.16.0
tracepanel run ./shop
Integrations
| Library | Module |
|---|---|
| gin | github.com/tracepanel/tracepanel-go/gintrace |
| Echo v4, v5 | github.com/tracepanel/tracepanel-go/echotrace, echo5trace |
| pgx v5 | github.com/tracepanel/tracepanel-go/pgxtrace |
| GORM v2 | github.com/tracepanel/tracepanel-go/gormtrace |
| go-redis v9 | github.com/tracepanel/tracepanel-go/redistrace |
| zap | github.com/tracepanel/tracepanel-go/zaptrace |
| zerolog | github.com/tracepanel/tracepanel-go/zerologtrace |
| gRPC | github.com/tracepanel/tracepanel-go/grpctrace |
| kafka-go | github.com/tracepanel/tracepanel-go/kafkatrace |
Each takes a line:
router.Use(gintrace.Middleware())                 // gin
err = db.Use(gormtrace.Plugin())                  // GORM
config.ConnConfig.Tracer = pgxtrace.Tracer()      // pgx
redistrace.Instrument(rdb)                        // go-redis
server := grpc.NewServer(grpctrace.ServerOptions()...)
The integrations page has each one, and what it records.
Your own code
// A span of the request's trace.
ctx, end := tracepanel.Span(ctx, "render invoice")
defer end()

// A task: a trace of its own, linked to the request that started it.
tracepanel.Go(ctx, "send welcome email", func(ctx context.Context) error {
	return mailer.Send(ctx, user)
})

// The signed-in user.
tracepanel.SetUser(ctx, strconv.FormatInt(user.ID, 10), user.Email)

// A debug print: each value with its expression, on stderr and in the trace.
tracepanel.Dump(ctx, order, user.Roles)
A program without an HTTP server calls tracepanel.Setup() first and
tracepanel.Flush(time.Second) before it exits.
MCP
The same traces for an AI coding agent (Claude Code, Cursor, Codex), from the project's directory:
claude mcp add --scope project tracepanel -- tracepanel mcp
Documentation
The documentation is at
tracepanel.dev/docs/go: installing, the
integrations, tracing your code, the settings and the tracepanel command.
The panel, the console and the issues are the same in every language, under
tracepanel.dev/docs.
Links
- tracepanel: what Tracepanel finds, how it works, privacy, and the agent this SDK downloads
- CHANGELOG.md: what changed in each version
Development
make lint       # gofmt, go vet, the tests of every module, every module built for Windows
make e2e        # an app against the real agent (e2e/, a module of its own)
make integrity  # the checksums of AgentVersion's binaries, once it is on npm
The tests that run the agent take a build of the sibling tracepanel
checkout, or the one TRACEPANEL_AGENT_BIN names. Each integration is a
module of its own, with a replace of the core to the checkout.
License
Licensed under the MIT License. The agent the SDK downloads,
tracepanel-agent, is free to use under the
FSL-1.1-ALv2:
source available, and Apache-2.0 two years after each release.
 Documentation

Overview 
Package tracepanel is Tracepanel for Go: it records each request of an app (its SQL with the line of code that ran each statement, its logs, its outgoing HTTP calls, its panics) and sends it to the Tracepanel agent, which finds the issues (N+1 queries, duplicates, slow SQL), keeps the traces in .tracepanel/ and serves the console. The middleware adds what the badge on a page reads (Server-Timing, Tracepanel-Id) and puts the badge into HTML pages.
db, err := sql.Open(tracepanel.Driver("pgx"), dsn)
http.ListenAndServe(addr, tracepanel.WrapHandler(mux))
It has no dependencies, and records nothing until WrapHandler or Setup turns it on, in development only: under `go run`, with TRACEPANEL_ENABLED=1 or Config.Enabled; a binary `go build` wrote records nothing, and TRACEPANEL_ENABLED=0 always wins. The agent comes with it: the first trace starts the one the SDK downloads (once, into the user's cache). Its MCP server, for AI coding agents, runs with the tracepanel command:
go install github.com/tracepanel/tracepanel-go/cmd/tracepanel@v0.10.0
tracepanel mcp
Index 
- Constants
- func Command(ctx context.Context, name string, fn func(context.Context) error) error
- func Driver(name string, options ...DBOption) string
- func Dump(ctx context.Context, values ...any)
- func Flush(timeout time.Duration)
- func Go(ctx context.Context, name string, fn func(context.Context) error)
- func Middleware(next http.Handler) http.Handler
- func Profile(ctx context.Context) context.Context
- func SetUser(ctx context.Context, id, username string)
- func Setup(config ...Config)
- func Span(ctx context.Context, name string) (context.Context, func())
- func TxContext(ctx context.Context, tx *sql.Tx) context.Context
- func WrapConnector(connector driver.Connector, options ...DBOption) driver.Connector
- func WrapHandler(handler http.Handler, config ...Config) http.Handler
- func WrapLogHandler(next slog.Handler) slog.Handler
- func WrapTransport(base http.RoundTripper) http.RoundTripper
- type Config
- type DBOption
Examples 
Constants 
const AgentVersion = "0.16.0"
AgentVersion is the agent this SDK runs, and downloads when it isn't installed: of the same minor as Version, a patch of its own. After changing it, `go generate` (or `make integrity`) writes the checksums of its binaries, which a download must match; a release checks they are of AgentVersion.
const Version = "0.16.0"
Version is this SDK's version.
Variables 
This section is empty.
Functions 
func Command 
Command records fn as a trace of its own: a scheduled job, a CLI command, a migration. An error it returns, or a panic, fails the trace (the panic goes on).
Example 
A command or a scheduled job, a trace of its own; Flush before the program exits.
package main

import (
	"context"
	"log"
	"log/slog"
	"time"

	tracepanel "github.com/tracepanel/tracepanel-go"
)

func main() {
	tracepanel.Setup()
	defer tracepanel.Flush(5 * time.Second)
	err := tracepanel.Command(context.Background(), "nightly cleanup", func(ctx context.Context) error {
		slog.InfoContext(ctx, "old sessions removed", "count", 42)
		return nil
	})
	if err != nil {
		log.Print(err)
	}
}
Output:
func Driver 
Driver is the name of the driver `name` with its statements recorded, for sql.Open (and sqlx.Open, GORM's DriverName, anything that opens by a driver's name; for GORM, this or gormtrace.Plugin, not both):
db, err := sql.Open(tracepanel.Driver("pgx"), dsn)
The first call registers it with database/sql, as "tracepanel:pgx". When Tracepanel is off (outside development), it is `name`.
Example 
The database opened through the wrapped driver: each statement run with a request's context is recorded, with the line that ran it.
package main

import (
	"database/sql"
	"log"
	"net/http"
	"os"

	tracepanel "github.com/tracepanel/tracepanel-go"
)

func main() {
	db, err := sql.Open(tracepanel.Driver("pgx"), os.Getenv("DATABASE_URL"))
	if err != nil {
		log.Fatal(err)
	}
	http.HandleFunc("GET /authors", func(w http.ResponseWriter, r *http.Request) {
		// With the request's context: QueryContext, not Query.
		rows, err := db.QueryContext(r.Context(), "SELECT id, name FROM authors")
		if err != nil {
			http.Error(w, err.Error(), http.StatusInternalServerError)
			return
		}
		defer rows.Close()
	})
}
Output:
Example (Options) 
A second database, a replica, named apart, of a kind its driver's name doesn't tell.
package main

import (
	"database/sql"
	"log"
	"os"

	tracepanel "github.com/tracepanel/tracepanel-go"
)

func main() {
	replica, err := sql.Open(
		tracepanel.Driver("pgx", tracepanel.DBAlias("replica"), tracepanel.DBSystem("postgresql")),
		os.Getenv("REPLICA_URL"),
	)
	if err != nil {
		log.Fatal(err)
	}
	defer replica.Close()
}
Output:
func Dump 
Dump prints values to stderr as a debug print does, each with the expression that gave it, its pretty Go-syntax text, its type and its length, under the line that called it:
tracepanel.Dump(ctx, order, user.Roles)

handlers.go:42 checkout
    order: &main.Order{
        ID:    7,
        Items: []main.Item{},
    } (*main.Order)
    user.Roles: []string{"admin"} ([]string) len=1
It always prints, also when Tracepanel isn't recording. When ctx carries a trace, the dump is recorded too, a log record on its current span that the console shows in the call tree. A value whose expression names a secret (password, token, api_key) is masked, printed and recorded, and so is a value inside one under such a name: a struct's field (Password, APIKey), a map's key ("token").
Example 
A debug print: the values with their expressions on stderr, and in the request's trace.
package main

import (
	"net/http"

	tracepanel "github.com/tracepanel/tracepanel-go"
)

func main() {
	http.HandleFunc("GET /cart", func(w http.ResponseWriter, r *http.Request) {
		cart := map[string]int{"tea": 2}
		tracepanel.Dump(r.Context(), cart)
	})
}
Output:
func Flush 
Flush waits until the traces recorded so far went to the agent, or `timeout` passed: a command calls it before it exits.
func Go 
Go runs fn on a goroutine of its own as a task: a trace of its own, linked to the trace in ctx that started it, where the start is a span. Its context keeps ctx's values but isn't canceled with it, so a task outlives the request that started it.
Example 
Work that outlives the request, as a task: a trace of its own, linked to the request that started it.
package main

import (
	"context"
	"log/slog"
	"net/http"

	tracepanel "github.com/tracepanel/tracepanel-go"
)

func main() {
	http.HandleFunc("POST /orders", func(w http.ResponseWriter, r *http.Request) {
		tracepanel.Go(r.Context(), "send receipt", func(ctx context.Context) error {
			slog.InfoContext(ctx, "receipt sent")
			return nil
		})
		w.WriteHeader(http.StatusAccepted)
	})
}
Output:
func Middleware 
Middleware is WrapHandler as a router's middleware, for chi's r.Use, gorilla's or echo's WrapMiddleware:
r.Use(tracepanel.Middleware)
Setup, called before it, gives it a Config. When Tracepanel is off, it returns the handler as it is.
func Profile 
Profile profiles the trace in ctx from here on, as the panel's Profile toggle profiles a request from its start: where its CPU time goes from now until it ends, a flame graph in the console (profile.reason "code"). The current goroutine is profiled; a goroutine the code starts for the trace is too when started with the context it returns.
ctx = tracepanel.Profile(ctx)
A trace profiled already (asked for, or TRACEPANEL_PROFILE=1) stays as it is; outside a trace, or with profiling off (TRACEPANEL_PROFILE_ENABLED=0), it returns ctx.
func SetUser 
SetUser names the signed-in user on the trace in ctx, as the app's authentication knows them: their id (user.id) and their username (user.username, left out when empty). The username stays on this machine: the agent drops it from what leaves it.
tracepanel.SetUser(r.Context(), strconv.FormatInt(user.ID, 10), user.Email)
Example 
The signed-in user, named on the request's trace.
package main

import (
	"net/http"
	"strconv"

	tracepanel "github.com/tracepanel/tracepanel-go"
)

func main() {
	type user struct {
		ID    int64
		Email string
	}
	http.HandleFunc("GET /account", func(w http.ResponseWriter, r *http.Request) {
		signedIn := user{ID: 7, Email: "ada@example.com"}
		tracepanel.SetUser(r.Context(), strconv.FormatInt(signedIn.ID, 10), signedIn.Email)
	})
}
Output:
func Setup 
func Setup(config ...Config)
Setup turns Tracepanel on for the process, once: the standard slog logger's records and the default HTTP client's calls join the traces. WrapHandler and Middleware call it. A program without an HTTP server (a worker, a command) calls it itself, and Flush before it exits. It turns Tracepanel on in development only: under `go run`, with TRACEPANEL_ENABLED=1 or with Config.Enabled; TRACEPANEL_ENABLED=0 leaves it off whatever else says.
func Span 
Span records a piece of the app's own code as a span of the trace in ctx, until the function it returns is called. Work done with the context it returns goes under it:
ctx, end := tracepanel.Span(ctx, "render invoice")
defer end()
Example 
A piece of the app's own code as a span.
package main

import (
	"log/slog"
	"net/http"

	tracepanel "github.com/tracepanel/tracepanel-go"
)

func main() {
	http.HandleFunc("GET /invoice", func(w http.ResponseWriter, r *http.Request) {
		ctx, end := tracepanel.Span(r.Context(), "render invoice")
		defer end()
		slog.InfoContext(ctx, "rendered")
	})
}
Output:
func TxContext 
TxContext is ctx for the work of the transaction `tx`, begun with ctx: what runs with it while `tx` is open (an outgoing HTTP call, a log record, a span, a query) goes under the transaction's span, and after the commit or the rollback under ctx's span again. database/sql keeps the context a transaction began with to itself, so the app asks for this one:
tx, err := db.BeginTx(ctx, nil)
ctx = tracepanel.TxContext(ctx, tx)
Outside a trace, or for a transaction that isn't recorded, it is ctx.
func WrapConnector 
WrapConnector is a driver's connector with its statements recorded, for sql.OpenDB:
db := sql.OpenDB(tracepanel.WrapConnector(stdlib.GetConnector(*config)))
When Tracepanel is off (outside development), it is `connector`.
func WrapHandler 
WrapHandler is Tracepanel in one line, around the app's handler (its ServeMux):
http.ListenAndServe(addr, tracepanel.WrapHandler(mux))
It turns Tracepanel on (Setup), and traces every request: its handler on a ServeMux is a `view` span named after its function, and the response gets what the badge reads, its headers (Tracepanel-Id, Server-Timing) and, in an HTML page, the badge itself. A page is held until the handler returns; any other response goes out as it is written. When Tracepanel is off (outside development), it returns the handler as it is.
Example 
The app's ServeMux, wrapped: each request a trace, its handler a span, the badge on its pages.
package main

import (
	"fmt"
	"log"
	"net/http"

	tracepanel "github.com/tracepanel/tracepanel-go"
)

func main() {
	mux := http.NewServeMux()
	mux.HandleFunc("GET /books/{id}", func(w http.ResponseWriter, r *http.Request) {
		fmt.Fprintf(w, "book %s", r.PathValue("id"))
	})
	log.Fatal(http.ListenAndServe("127.0.0.1:8080", tracepanel.WrapHandler(mux)))
}
Output:
func WrapLogHandler 
WrapLogHandler adds slog records to the trace of the context they were logged with (slog.InfoContext(ctx, ...)), then passes them on to `next`. Setup puts it in front of the standard logger's handler; a logger of the app's own takes it as its handler:
logger := slog.New(tracepanel.WrapLogHandler(slog.NewJSONHandler(os.Stdout, nil)))
A record keeps its level, its message, the line that logged it, and each attribute as an extra field (extra.name, a group's extra.group.name), a secret-looking one masked.
func WrapTransport 
func WrapTransport(base http.RoundTripper) http.RoundTripper
WrapTransport records the calls made through `base` (http.DefaultTransport when nil):
client := &http.Client{Transport: tracepanel.WrapTransport(nil)}
Setup gives it to http.DefaultClient, so its calls are recorded already. http.DefaultTransport stays as it is: code asserts it is an *http.Transport. A call is recorded when its request has the context of a traced request: use http.NewRequestWithContext(ctx, ...). It carries the trace's traceparent, and X-Tracepanel-Profile when the request was asked to be profiled, so the app it reaches links its trace to the call.
Example 
An HTTP client of the app's own, whose calls are recorded and carry the trace's traceparent.
package main

import (
	"net/http"
	"time"

	tracepanel "github.com/tracepanel/tracepanel-go"
)

func main() {
	client := &http.Client{Transport: tracepanel.WrapTransport(nil), Timeout: 10 * time.Second}
	http.HandleFunc("GET /rates", func(w http.ResponseWriter, r *http.Request) {
		request, _ := http.NewRequestWithContext(r.Context(), "GET", "https://api.example.com/rates", nil)
		response, err := client.Do(request)
		if err != nil {
			http.Error(w, err.Error(), http.StatusBadGateway)
			return
		}
		defer response.Body.Close()
	})
}
Output:
Types 
type Config 
type Config struct {
	// The app's name in the console: TRACEPANEL_SERVICE, else the executable's name.
	Service string
	// Where the agent serves the console: the badge loads from there and opens it. TRACEPANEL_CONSOLE_URL, else the
	// address the project's agent writes (console.addr), on whatever port it got.
	ConsoleURL string
	// The project's store directory, where the agent keeps the traces: TRACEPANEL_DIR, else .tracepanel.
	StoreDir string
	// The app's module path: frames under it are the project's code. The main module's, read from the build.
	Module string
	// The most traces the agent keeps for the project: TRACEPANEL_MAX_TRACES, else 2000.
	MaxTraces int
	// The route of a request, for a router that doesn't set Request.Pattern as ServeMux does: "/books/{id}".
	Route func(*http.Request) string
	// Record in this build, not only under `go run` or with TRACEPANEL_ENABLED=1: a staging build, say. Set up
	// before Driver, so the database is recorded too. TRACEPANEL_ENABLED=0 still turns Tracepanel off.
	Enabled bool
	// Profile every trace (where its CPU time went, a flame graph in the console), not only a request that asks
	// with the panel's Profile toggle: TRACEPANEL_PROFILE=1. TRACEPANEL_PROFILE_ENABLED=0 profiles nothing.
	Profile bool
	// Measure every profiled trace's memory (what the heap allocated while it ran), not only a request's that asks
	// for "memory": TRACEPANEL_PROFILE_MEMORY=1.
	ProfileMemory bool
	// How often the profiler samples a profiled trace, in CPU time: TRACEPANEL_PROFILE_INTERVAL_MS, else every
	// millisecond (Go's own profiler samples every 10 ms). At most every 100 µs.
	ProfileInterval time.Duration
}
Config is optional: what it leaves empty comes from TRACEPANEL_* variables, then defaults.
type DBOption 
type DBOption func(*database)
DBOption tells Driver or WrapConnector more about the database.
func DBAlias 
DBAlias names the database among the app's ("default"): a second one, such as a replica, gets a name of its own.
 Source Files

- about.go
- agent.go
- bridge.go
- capture.go
- client.go
- cputime_other.go
- database.go
- dbname.go
- detach_unix.go
- dump.go
- enabled.go
- explain.go
- explainable.go
- logs.go
- memory.go
- middleware.go
- model.go
- pprof.go
- profile.go
- profile_rate.go
- recording.go
- secrets.go
- sql.go
- stack.go
- start.go
- stderr_linux.go
- stderr_unix.go
- tracepanel.go
- version.go
- w3c.go
 Directories

| Path | Synopsis |
|---|---|
|
cmd
|
|
|
tracepanel
command
Command tracepanel runs the Tracepanel agent the Go SDK runs (the one in the user's cache, downloaded the first time), for what a Go project has no pip or npm to run it with, and a built app recording:
|
Command tracepanel runs the Tracepanel agent the Go SDK runs (the one in the user's cache, downloaded the first time), for what a Go project has no pip or npm to run it with, and a built app recording: |
|
echo5trace
module
|
|
|
echotrace
module
|
|
|
gintrace
module
|
|
|
gormtrace
module
|
|
|
grpctrace
module
|
|
|
internal
|
|
|
agentbin
Package agentbin finds the Tracepanel agent's binary for a Go app, which has no pip or npm to install it: the agent this SDK was released with, downloaded once from its npm platform package (the same binary as on PyPI and Maven Central), checked against the SHA-512 this SDK holds for it (integrity.go), and kept in the user's cache (~/.cache/tracepanel/agent/VERSION/PLATFORM/), shared by every project and every SDK.
|
Package agentbin finds the Tracepanel agent's binary for a Go app, which has no pip or npm to install it: the agent this SDK was released with, downloaded once from its npm platform package (the same binary as on PyPI and Maven Central), checked against the SHA-512 this SDK holds for it (integrity.go), and kept in the user's cache (~/.cache/tracepanel/agent/VERSION/PLATFORM/), shared by every project and every SDK. |
|
hook
Package hook is what the integrations (pgxtrace, gintrace, grpctrace and the others, each a module of its own) record traces with: the core package fills these in when it loads, so the rules of a trace stay in one place.
|
Package hook is what the integrations (pgxtrace, gintrace, grpctrace and the others, each a module of its own) record traces with: the core package fills these in when it loads, so the rules of a trace stay in one place. |
|
integrity
command
Command integrity writes internal/agentbin/integrity.go: the SHA-512 of the agent's binary for each platform, at the version AgentVersion names in version.go (or -version), which the SDK checks a downloaded agent against.
|
Command integrity writes internal/agentbin/integrity.go: the SHA-512 of the agent's binary for each platform, at the version AgentVersion names in version.go (or -version), which the SDK checks a downloaded agent against. |
|
tracetest
Package tracetest records the traces of an integration's tests, as the agent would get them.
|
Package tracetest records the traces of an integration's tests, as the agent would get them. |
|
kafkatrace
module
|
|
|
pgxtrace
module
|
|
|
redistrace
module
|
|
|
zaptrace
module
|
|
|
zerologtrace
module
|