

 README

README

asciigraph




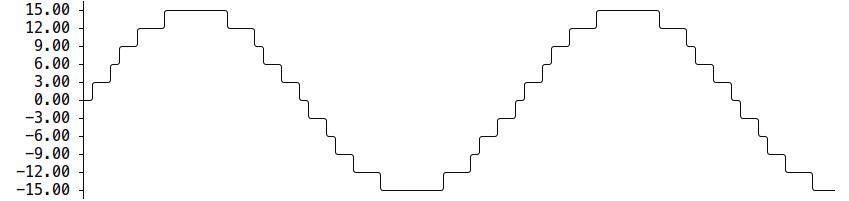
Go package to make lightweight ASCII line graphs ╭┈╯.
Installation
go get github.com/guptarohit/asciigraph
Usage
Basic graph
package main

import (
    "fmt"
    "github.com/guptarohit/asciigraph"
)

func main() {
    data := []float64{3, 4, 9, 6, 2, 4, 5, 8, 5, 10, 2, 7, 2, 5, 6}
    graph := asciigraph.Plot(data)

    fmt.Println(graph)
}
Running this example would render the following graph:
  10.00 ┤        ╭╮
   9.00 ┤ ╭╮     ││
   8.00 ┤ ││   ╭╮││
   7.00 ┤ ││   ││││╭╮
   6.00 ┤ │╰╮  ││││││ ╭
   5.00 ┤ │ │ ╭╯╰╯│││╭╯
   4.00 ┤╭╯ │╭╯   ││││
   3.00 ┼╯  ││    ││││
   2.00 ┤   ╰╯    ╰╯╰╯
Command line interface
This package also brings a small utility for command line usage.
Assuming $GOPATH/bin is in your $PATH, simply go get it then
install CLI.
CLI Installation
go install github.com/guptarohit/asciigraph/cmd/asciigraph
or download binaries from the releases page.
Feed it data points via stdin:
$ seq 1 72 | asciigraph -h 10 -c "plot data from stdin"
  72.00 ┼
  65.55 ┤                                                                  ╭────
  59.09 ┤                                                           ╭──────╯
  52.64 ┤                                                    ╭──────╯
  46.18 ┤                                             ╭──────╯
  39.73 ┤                                      ╭──────╯
  33.27 ┤                              ╭───────╯
  26.82 ┤                       ╭──────╯
  20.36 ┤                ╭──────╯
  13.91 ┤         ╭──────╯
   7.45 ┤  ╭──────╯
   1.00 ┼──╯
           plot data from stdin
Realtime graph for data points via stdin:
$ ping -i.2 google.com | grep -oP '(?<=time=).*(?=ms)' --line-buffered | asciigraph -r -h 10 -w 40 -c "realtime plot data (google ping in ms) from stdin"

Acknowledgement
This package started as golang port of asciichart.
Contributing
Feel free to make a pull request! :octocat:
 Documentation

Documentation

Index 
Constants 
This section is empty.
Variables 
View Source
var Clear func()
clear terminal screen
Functions 
Types 
type Option ¶ added in v0.3.0
type Option interface {
	// contains filtered or unexported methods
}
Option represents a configuration setting.
 Source Files
 Directories
Click to show internal directories.
Click to hide internal directories.